
https://www.bettycjung.net/Blog2013b.htm


Blogging since 2000....

|
 |
 |


|

|

Custom Search
|
Custom Search
|


| January - June | July - December |

Graphic source: http://www.bls.gov/spotlight/2008/sports/ |
Here is an interesting graphic which shows what men and women do for exercise. The top 3 forms of exercise favored by women include aerobics, yoga and walking (vs. football, basketball and golfing for men).
For more information, see Fitness Resources |
According to 2010 Percent of Women Ages 18+ who Reported Any Exercise in the Past 30 Days*, by State, Age Adjusted that is based on CDC Behavioral Risk Factor Surveillance System, 2010, 74.2% of all women, 77.1% of White women, 65.85 of Black women and 67.7% of Hispanic women reported having exercised within the past 30 days.
Overall, women living in Puerto Rico exercised the least (51.8%). Those who were the least active were West Virginia White women (67.2%); Nebraska Black women (50.8%); Puerto Rico Hispanic women (51.7%).

Graphic source: http://www.medscape.org/viewarticle/734161_3 |
 In 2007, the Annals of Internal Medicine reported that diabetes increases one's risk for dying from any cause, and specifically cardiovascular disease. While the all-cause and CVD mortality rate is higher for men, data trends show that it is decreasing over time. As for women, while the all cause and CVD mortality rate is not as high as for men, the all-cause and CVD mortality rate for women, unfortunately, has actually increased over time. In 2007, the Annals of Internal Medicine reported that diabetes increases one's risk for dying from any cause, and specifically cardiovascular disease. While the all-cause and CVD mortality rate is higher for men, data trends show that it is decreasing over time. As for women, while the all cause and CVD mortality rate is not as high as for men, the all-cause and CVD mortality rate for women, unfortunately, has actually increased over time.
For more information, see 2000-2009 Female (All Ages) Diabetes Death Rate*, United States, Age-Adjusted, by Race which shows a reduction in diabetes mortality for women that varies by race and ethnicity. |
According to 2010 Percent of Women Ages 18+ who Reported Ever Having Diabetes*, by State, Age-Adjusted 9.8% of American women reported having diabetes. However, this rate varies by race and ethnicity. 8.2% of White women, 15.9% of Black women and 15.0% of Hispanic women reported having diabetes.
Guam women has the greatest percentage of diabetes (14.6%), followed by Mississippi (13.6%), Alabama (12.8%) and South Carolina (12.1%)
Alabama White women have the highest rate of diabetes (11.0%), followed by Mississippi (10.9%), Tennessee (10.8%) and Kentucky and Missouri (10.6% each). Nevada Black women have the highest rate of diabetes (20.8%, although this seems a bit strange to me), followed by Kentucky (19.1%), Mississippi (18.9%), and South Carolina (18.5%). Georgia Hispanic women have the highest rate of diabetes (21.8%), followed by Nebraska and Tennessee (21.2% each, strange for NE), and U.S. Virgin Islands (19.5%).

Graphic source: http://www.cdc.gov/nchs/data/databriefs/db106.htm |
According to CDC's NCHS Data Brief Number 106, September 2012 -"Prevalence of Obesity Among Older Adults in the United States, 2007-2010":
"There was a linear trend among women aged 65-74: There was a decrease in obesity prevalence with increasing education. Almost one-half of those with less than a high school education were obese compared with about one-third of those with a college degree. No linear trends in obesity prevalence by educational attainment were observed in men or women aged 75 and over." Citation source: http://www.cdc.gov/nchs/data/databriefs/db106.htm Well, it would appear that getting an education can turn out to be very beneficial for women in the long run! |

Graphic source: http://www.cdc.gov/nchs/data/databriefs/db106.htm |
According to CDC's NCHS Data Brief Number 106, September 2012 -"Prevalence of Obesity Among Older Adults in the United States, 2007-2010":
...the prevalence of obesity differed by race and ethnicity among women. Among women aged 65-74, 53.9% of non-Hispanic black women were obese, compared with 38.9% of non-Hispanic white women, but was not significantly different from Hispanic women (46.6%). Among women aged 75 and over, 49.4% of non-Hispanic black women were obese, 30.2% of Hispanic women were obese, and 27.5% of non-Hispanic white women were obese." Citation source: http://www.cdc.gov/nchs/data/databriefs/db106.htm |

Graphic source: http://www.cdc.gov/nchs/data/hestat/obesity_adult_09_10/obesity_adult_09_10.htm |
According to Prevalence of Overweight, Obesity, and Extreme Obesity Among Adults: United States, Trends 1960-1962 Through 2009-2010 between 1988-1994 and 2009-2010, the prevalence of obesity among women increased:
Source: CDC/NCHS, National Health and Nutrition Examination Survey (NHANES) III 1988-1994 and NHANES 2009-2010. |

Graphic source: http://www.cdc.gov/nchs/data/hestat/obesity_adult_09_10/obesity_adult_09_10.htm |
Data trends are useful in looking at phenomena over time. Over a 50-year period, one can see that U.S. women are getting heavier over time. Perhaps, the most disturbing trend is the percent of obese women have grown faster than the percent of overweight women.
Source: CDC/NCHS, National Health Examination Survey I 1960-1962; National Health and Nutrition Examination Survey (NHANES) I 1971-1974; NHANES II 1976-1980; NHANES III 1988-1994; NHANES 1999-2000, 2001-2002, 2003-2004, 2005-2006, 2007-2008, and 2009-2010. |
According to the 2010 Percent of Women Ages 20+ who are Obese*, by State, Age-Adjusted 27.5% of U.S. women are obese (Percent of persons age 20+ identified as obese according to their reported weight and height (body mass index >= 30.0). By race and ethnicity, 24.4% of White women, 44.9% of Black women and 32.5% of Hispanic women are obese.
By state of residence, Mississippi has the highest percentage of obese women(35.9%), of which 50.1% of Black women living in that state are obese. However, the state with the greatest of Black obese women reside in Michigan (55.4%), followed by Arkansas (53.5%), Alabama (52.2%) Wisconsin (51.7%),Illinois (51.5%), and then Mississippi, coming in 6th. These state-based statistics indicate that these states may need to develop programs to fight obesity among African-American women.
|
Here is an interesting table from Cancer Research UK that shows the level of responsibility that tobacco has for various cancers. They report:
"Smoking is the single greatest avoidable risk factor for cancer; in the UK, it is the cause of more than a quarter (28%) of all deaths from cancer and has killed an estimated 6.5 million people over the last 50 years.2 A study published in December 2011 estimated that smoking causes nearly a fifth of all cancer cases in the UK. Worldwide, tobacco consumption caused an estimated 100 million deaths in the last century and if current trends continue it will kill 1,000 million in the 21st century.36 Around half of all regular smokers will die from the habit, half of these in middle age."
I included this just to show that not only is tobacco use a risk factor for cardiovascular disease, but also for cancer as well. It may be of particular interest to women that tobacco is linked to a possible factor in breast cancer, and to liver cancer in children of parents who smoke. All the more reason to quit. |
 |
Make sure you stay around to watch your kids grow up. Besides eating healthy and exercising daily, make sure your health is in tip-top shape. Make the appointment and get screened. Man up and wear the gown!
For additional information, see Men's Health |
|
According to April 2012 NCHS Data Brief, "Total and High-density Lipoprotein Cholesterol in Adults: National Health and Nutrition Examination Survey, 2009-2010"
"Among adults aged 40-59, a decreasing trend was observed in the percentage of men with high total cholesterol during 1999-2010, but not for women (Figure 3). For men, the percentage with high total cholesterol declined from 24.8% for 1999-2000 to 16.7% for 2009-2010.
For adults aged 60 and over, a decreasing trend in high total cholesterol was observed in both men and women, with women having consistently higher percentages of high total cholesterol than men."
For more information, see High Blood Pressure and Women and Heart Disease |

Graphic source:http://www.mchb.hrsa.gov/whusa12/hs/hshi/pages/hbp.html |
According to Women's Health USA 2012:
"High blood pressure, or hypertension, is a risk factor for heart disease and stroke, which are among the leading causes of death in the United States (see Heart Disease and Stroke). It is defined as a systolic blood pressure (during heartbeats) of 140 mmHg or higher, a diastolic blood pressure (between heartbeats) of 90 mmHg or higher, or current use of blood pressure-lowering medication. In 2007-2010, 27.5 percent of women were identified as having high blood pressure. This includes 15.6 percent of women with controlled hypertension, who had a normal blood pressure measurement and reported using blood pressure-lowering medication, and 11.9 percent with uncontrolled hypertension, who had a high blood pressure measurement with or without the use of medication. In addition to medication, high blood pressure can also be controlled by losing excess body weight, participating in regular physical activity, avoiding tobacco smoke, and adopting a healthy diet with lower sodium and higher potassium intake."
For more information, see High Blood Pressure and Women and Heart Disease |

Graphic source: http://www.mchb.hrsa.gov/whusa12/hs/hshi/pages/hbp.html |
According to Women's Health USA 2012:
"The prevalence of hypertension does not vary by sex, but increases with age, affecting approximately 3 out of 4 women aged 65 and older in 2007-2010 (74.4 percent). Hypertension also varies by race and ethnicity. Over 40 percent of non-Hispanic Black women had hypertension compared to about 25 percent of non-Hispanic White, Mexican American, and Other Hispanic women. However, both non-Hispanic Black and Mexican American women were more likely to have uncontrolled hypertension than non-Hispanic White women (19.5 and 15.8 versus 10.4 percent; respectively)."
For more information, see High Blood Pressure and Women and Heart Disease |
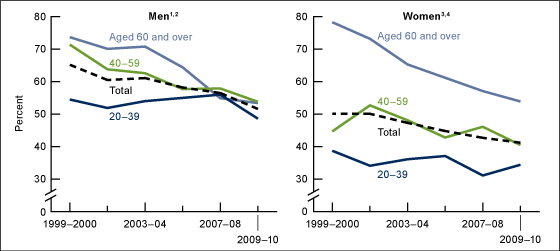 1 Significant decreasing linear trend for age groups 40-59 and 60 and over (p < 0.05). 2 In 2009-2010, significantly different from women. 3 Significant decreasing linear trend for age group 60 and over (p < 0.05). 4 In 2009-2010, women aged 60 and over significantly different from women aged 40-59 and 20-39. NOTES: Data include participants examined as part of the morning fasting subsample only and exclude pregnant women. Data are age-adjusted to year 2000 U.S. Census Bureau estimates using age groups 20-39, 40-59, and 60 and over. LDL is low-density lipoproteins. SOURCE: CDC/NCHS, National Health and Nutrition Examination Survey, 1999-2010. Graphic source: http://www.cdc.gov/nchs/data/databriefs/db103.htm |
National Center for Health Statistics Data Brief, "Prevalence of Uncontrolled Risk Factors for Cardiovascular Disease: United States, 1999-2010" (August 2012; #103) provided some small hope that women are doing better with cardiovascular, especially those 60 and over!!
For more information see Women and Heart Disease |

Graphic source: http://womenshealth.gov/publications/our-publications/fact-sheet/stroke.cfm |
According to womenshealth.gov:
When it comes to strokes, time is the of the essence. The sooner a person gets the medical care, the greater the chance that the person will be left with less disabilities. For more information, see Cerebrovascular Disease |

Graphic source: http://womenshealth.gov/publications/our-publications/fact-sheet/heart-disease.cfm |
According to New York-Presbyterian Hospital's "What are the warning signs of a heart attack?"
For more information see CDC's Women and Heart Disease Fact Sheet Also, see Women and Heart Disease |

Graphic source: http://www.cardiachealth.org/ca-blog/why-heart-disease-women-different |
In order to address heart disease, the best way is to identify the risk factors. According to the CDC:
|

Graphic source:http://www.cdc.gov/dhdsp/data_statistics/fact_sheets/fs_women_heart.htm |
According to the CDC:
For more information, see Women and Heart Disease |

Graphic source: http://www.usabledt.com/cigarette-smoking-statistics/ |
Here are some good reasons why one should stop smoking, or if you don't, all the reasons why one shouldn't start!
According to the American Lung Association:
For more information, see Tobacco |

Graphic source: http://online.wsj.com/article/SB10001424052748704764404575287081156194368.html |
Wall Street Journal's "Lung Cancer in Women on the Rise" reports:
For more information, see Cancer |

Graphic source: http://www.cdc.gov/vitalsigns/bingedrinkingfemale/infographic.html |
According to the CDC,
For more info, see Binge Drinking Infographic |

Graphic source: CDC Releases Data on Interpersonal and Sexual Violence by Sexual Orientation E-mail |
The CDC has been compiling data about domestic violence for quite some time. According to its 1/25 listserv, "On January 25, 2013, the Centers for Disease Control and Prevention (CDC) released the first of its kind report on the national prevalence of intimate partner violence, sexual violence and stalking victimization by respondents sexual orientation. This report highlights the prevalence of intimate partner violence (IPV), sexual violence (SV), and stalking of respondents who self-identified as lesbian, gay or bisexual at the time of the survey and describe violence experienced with both same-sex and opposite-sex partners, using 2010 data from the National Intimate Partner and Sexual Violence Survey (NISVS)."
Just click on the graphic to access the CDC's "2010 Findings on Victimization by Sexual Orientation" of its National Intimate Partner and Sexual Violence Survey. Also, see Domestic Violence |

Source and Enlarged Graphic |
|
For more information, see Domestic Violence |
| ""I've never met one victim who was able to report the crime and still retain their military career," she says. "Not one." (Myla Haider)
According NPR.org 3/13/13's "Sexual Violence Victims Say Military Justice System Is 'Broken'"
|

Graphic source: http://www.notinvisible.org/ Last year I viewed the documentary,"The Invisible War" which was about rape in the military. It was a disturbing film because this issue of female soldiers serving our country being raped by mostly their immediate superiors should be addressed. Fortunately, there is a Web site offering support to those women and their families. Unfortunately, I know a mother of a female soldier who was raped in the military, and it is heartbreaking what this does not only to the soldier but also to her family. See also the 5/7/13 NY Times article, Sexual Assaults in Military Raise Alarm in Washington for President Obama's call to investigate sexual assault in the military. Article also includes, "...In 2010, a similar Pentagon survey found that 4.4 percent of active-duty women and fewer than 0.9 percent of active-duty men had experienced sexual assault." For more information, click on the graphic, or Invisible No More.org |

Graphic source: http://womensrightswithoutfrontiers.org/index.php |
It is hard to believe that such a primitive practice as limiting the number of females born still exist today. In many countries, females are not only second-class citizens, many are just lucky to be born and come of age. Countries that practice gendercide (or prevent it from happening) are paying the price when boys come of age and there are no girls of marriageable age available.
To learn more about this crude practice, see Gendercide - Boys without Girls
|
| American women take for granted that reproductive services will always be available when they decide to start a family. But, this is not the experience of many women living in countries where there is political unrest.
According to the CDC,
For more information, see Reproductive Health |

Graphic source: http://www.cdc.gov/hiv/topics/women/index.htm |
New HIV Infections
For more information, see HIV & Women |

Graphic source:http://www.mchb.hrsa.gov/whusa11/hstat/hshi/pages/219sti.html |
Healthy People 2020 provides guidance about various issues impacting the population in general, and specific population groups. Safe sex prevents women from contracting sexually-transmitted diseases or infections (STDs/STIs), some of which are treatable, while others are not. Bacterial STDs not treated can lead to pelvic inflammatory disease, which can affect a woman's fertility.
Baseline data show that "7.4 percent of females aged 15 to 24 years who attended family planning clinics in the past 12 months tested positive for chlamydia trachomatis infections in 2008." The target is 6.7 percent. For more information, see CDC's Prevention. How You Can Prevent Sexually Transmitted Diseases Also, see Sexually-transmitted Diseases/Infections |

Graphic source: http://www.mchb.hrsa.gov/whusa11/more/hp2020.html |
Here is an excellent table that identifies all the public health issues that women face today and the Healthy People 2020 target goals to improving women's health. As you can see from the baseline statistics, there is plenty of room for improvement.
|

Graphic source: http://ask.hrsa.gov/detail_materials.cfm?ProdID=4914 |
One of the best statistical resources for women's health is HRSA's annual "Women Health USA" reports. It provides the latest statistics for:
Click on the graphic to access the 2012 online and pdf editions these annual reports. For more information, see US Government Statistics, and Maternal Child Health Data |

Graphic source: http://www.health.state.mn.us/divs/idepc/immunize/hcp/pregvax.html |
While on the topic of women taking care of themselves, here is a "Pregnancy and Vaccination Pocket Guide" developed by the Minnesota Department of Health. It's always best to keep up with vaccines and get them at the appropriate time. However, exposure to potential pathogens may warrant getting some vaccines while pregnant. Important to keep in mind that some may be contraindicated. Check with your health care provider.
See Minnesota Department of Health's Pregnancy and Vaccination Pocket Guide for more information. Also, see Vacccines.gov and Vaccineinformation.org |

Graphic source: http://womenshealth.gov/nwhw/health-resources/ |
Womenshealth.gov provides a very helpful chart of what kinds of screening you should get to stay healthy, organized by age groups. Unfortunately, the site is no longer available (12/2013). |
The purpose of the 11th annual National Women's Checkup Day is to:
For more information, see Women's Health - General Resources |

Graphic source: http://www.homelifeweekly.com/mothers-day/printable-mothers-day-cards/ |
Happy Mother's Day to all women who believe in the power of nurturing! On this day, take a moment to reflect on how important it is to take care of ourselves so we can continue to nurture those we love! |
 |
The Office of Women's Health's "Women's Health and Mortality Chartbook" is an excellent online interactive resource to search for state-level women's health data pertaining to:
See how women are doing in your state, by race and ethnicity, against Healthy People 2020 Objectives, and how your state ranks against other states. Access the chartbook by clicking on the graphic. Here is the Connecticut Profile . At a glance you can see which area Connecticut need to improve on when compared to Healthy People 2020's National Targets (e.g., current smoking, breast cancer, mammography, colorectal cancer screening), when it comes to women's health issues. |
"Since 2003, the Agency for Healthcare Research and Quality (AHRQ) has annually reported on progress and opportunities for improving health care quality and reducing health care disparities. As mandated by the U.S. Congress, the National Healthcare Quality Report (NHQR) focuses on "national trends in the quality of health care provided to the American people" while the National Healthcare Disparities Report (NHDR) focuses on "prevailing disparities in health care delivery as it relates to racial factors and socioeconomic factors in priority populations." Priority populations include racial and ethnic minorities, low-income groups, women, children, older adults, residents of rural areas and inner cities, and individuals with disabilities and special health care needs."
Citation source: http://www.ahrq.gov/research/findings/nhqrdr/nhqrdr11/minority-women.html
Selected Highlights from 2011's report include:
The CDC has been compiling leading causes of death in females almost annually since 1998. For the most current complete year of statistics, Leading Causes of Death in Females United States, 2009 (current listing), the CDC offers a breakdown of mortality data, by race and ethnicity.
Overall, heart disease (24%) is the leading cause of death, followed by cancer (22.2%). This is not necessarily true for all women of color. Heart disease is only the leading cause of death for white and black females. Cancer is the leading cause of death for American Indian/Alaskan Native, Asian or Pacific Islander and Hispanic females!
While stroke is the 3rd leading cause of death for females, overall, this is only true for all women of color. For white women, chronic lower respiratory diseases is the 3rd leading cause of death, probably due to tobacco use.
Such mortality data indicate the importance of looking at such disparities by race and ethnicity as it helps to identify areas that may be missed by just looking at the overall population. For example, tobacco cessation messages may need to target white women more, while encouraging cancer screening among women of color would help to reduce the greater cancer mortality among these women.

Graphic source: http://www.endotext.org/aging/aging17/agingframe17.htm |
NCHS 2006 statistics show that heart disease and cancer are the leading causes of death for postmenopausal women.
"The largest health threat to women over aged 50 is cardiovascular disease. In women age 45-49, the incidence of cardiovascular disease is 3 times lower than men of matched age. However, data from the Framingham study have shown that by age 75-79, a woman's risk of heart disease increases and equals a man's risk for her age." Citation source: http://www.endotext.org/aging/aging17/agingframe17.htm |

Graphic source: http://www.cdc.gov/women/contributions/index.htm |
Want an overview of public health issues affecting U.S. women today? Well, then check out the timeline the CDC and ATSDR have developed to document what they have done to improve the quality of women's lives.
Click on the graphic, or go to A Timeline of CDC/ATSDR Contributions to Women's Health |

Graphic source: http://www.health.gov/paguidelines/guidelines/default.aspx The "2008 Physical Activity Guidelines for Americans" is the most current national guidance regarding physical activity. Key Guidelines include: Children and Adolescents (aged 6-17)
|
Adults (aged 18-64)
Older Adults (aged 65 and older)
Citation source: "At-A-Glance: A Fact Sheet for Professionals" http://www.health.gov/paguidelines/factsheetprof.aspx Click on graphic to get to document. For more information, see Fitness Resources and Obesity This was originally posted December 1, 2011 |
|
|
|

"National Women's Health Week is a weeklong health observance coordinated by the U.S. Department of Health and Human Services' Office on Women's Health. It brings together communities, businesses, government, health organizations, and other groups in an effort to promote women's health and its importance. It also empowers women to make their health a priority and encourages them to take the following steps to improve their physical and mental health and lower their risks of certain diseases:
Citation source: http://womenshealth.gov/nwhw/about/
Once again, I am pleased to host an online event on my Web site. Like the last two years, I will be devoting May's blog entries to women's health. This year's theme is: Critical Public Health Issues Affecting Women Today As you can see, I will be covering a variety of topics, and if it runs over into June, then so be it. Hope you learn something new in the coming weeks about health of over half the world's population!
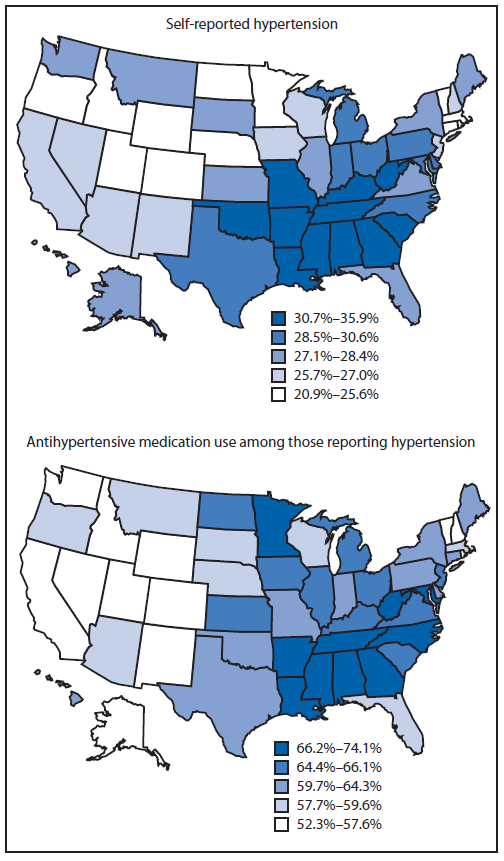
Graphic source: http://www.cdc.gov/mmwr/preview/mmwrhtml/mm6213a2.htm |
CDC's "Self-Reported Hypertension and Use of Antihypertensive Medication Among Adults United States, 2005-2009" (MMWR 4/5/13) reports:
|

Graphic source: http://www.cdc.gov/nchs/data/databriefs/db107.htm |
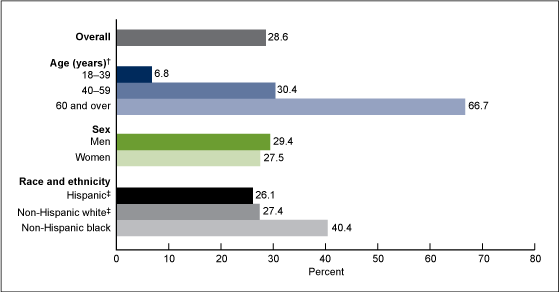
According to the October 2012 NCHS Data Brief, "Hypertension Among Adults in the United States, 2009-2010":
While the trends are promising, it is still not enough. Most present statistics indicate that only slightly more than 1/2 of Americans with high blood pressure have it under control! For more information, see Hypertension |
Graphic source:http://www.cdc.gov/nchs/data/databriefs/db107.htm |
According to the October 2012 NCHS Data Brief, "Hypertension Among Adults in the United States, 2009-2010":
While the majority of those over 60 have high blood pressure, it is disconcerting to see that overall, over 1/4 of Americans are hypertensive. If people are healthy, they would not be hypertensive. More exercise and healthier diet are necessary, or stroke prevalence will rise! For more information, see Cardiovascular Disease and Cerebrovascular Disease |
 |
According to 9/2012 MMWR's "Awareness and Treatment of Uncontrolled Hypertension Among Adults, United States, 2003-2010":
For more information, see Hypertension |

Graphic source:http://www.cardiovascularhypertension.com/statistics/high-blood-pressure-and-hypertension-statistics-in-the-us/ |
According to Cardiovascular Hypertension:
|

Graphic source: http://www.hypertensiononline.org/slides2/slide01.cfm?tk=22&dpg=2http://www.hypertensiononline.org/slides2/slide01.cfm?tk=22&dpg=2 |
According to Hypertension Online:
"The prevalence of hypertension in a representative sample of the United States population from the National Health and Nutrition Examination Survey (NHANES 1999-2000) reveals that approximately 28.4% of the adult population has hypertension and that the prevalence of hypertension increases sharply with advancing age. The 1999-2000 NHANES was conducted in the United States among a representative sample (n = 4,531) of adult, noninstitutionalized, nonpregnant civilians with the goals of 1) estimating the prevalence of selected diseases and risk factors; 2) estimating population reference distributions of certain health parameters; 3) documenting and investigating reasons for secular trends in selected diseases and risk factors; 4) contributing to an understanding of disease etiology; and 5) investigating the natural history of selected diseases. Although Ong et al. (2007) and Ostchega et al. (2008) have published data from more recent NHANES in which subjects were classified into broader age groups (18-39 years, 40-59 years, and =/>;60 years) this graph is more illustrative of the increasing hypertension prevalence with age in the United States. Since 1999, the overall age-adjusted prevalence of hypertension in the United States has varied little, ranging between only 28% and 30%. Nevertheless, the relationship of hypertension and aging is still important, especially since another 28% of adults were found in NHANES 2005-2006 to have prehypertension (defined as a systolic blood pressure between 120 and 139 mm Hg, a diastolic blood pressure between 80 and 89 mm Hg, or pharmacologically untreated hypertension) and could become fully hypertensive as they age.
|

Graphic source:http://www.hkma.org/english/cme/onlinecme/cme200401main.htm |
Here is the reason why hypertension is such an important condition, why not treated will result in cardiovascular and cerebrovascular diseases.
For more information, see Cardiovascular Disease |

Graphic source: http://www.iashonline.org/category/news |
According to the Inter-American Society of Hypertension, "Globally, around 40% of adults aged 25 and over had raised blood pressure in 2008."
Citation source: http://www.iashonline.org/category/news |

Graphic source: http://directorsblog.nih.gov/high-blood-pressure-a-global-health-threat/ |
According to NIH's 4/4/13 "High Blood Pressure, a Global Health Threat" :
|

Graphic source: http://www.nbcnews.com/id/18660422/ns/health-heart_health/ |
Having just finished February looking at heart disease, I have decided to follow that up with a closer look at those risk factors associated with heart disease.
Perhaps the most common risk factor is high blood pressure, also known at hypertension. Hypertension is actually a growing global problem. According to Associated Press,
Citation source: http://www.nbcnews.com/id/18660422/ns/health-heart_health/
For more information, see Cardiovascular Disease
|
|
1 Significant decreasing linear trend for age groups 40-59 and 60 and over (p < 0.05). 2 In 2009-2010, significantly different from women. 3 Significant decreasing linear trend for age group 60 and over (p < 0.05). 4 In 2009-2010, women aged 60 and over significantly different from women aged 40-59 and 20-39. NOTES: Data include participants examined as part of the morning fasting subsample only and exclude pregnant women. Data are age-adjusted to year 2000 U.S. Census Bureau estimates using age groups 20-39, 40-59, and 60 and over. LDL is low-density lipoproteins. SOURCE: CDC/NCHS, National Health and Nutrition Examination Survey, 1999-2010. Graphic source: http://www.cdc.gov/nchs/data/databriefs/db103.htm |
According to August 2012, "NCHS Data Brief Number 103, August 2012, Prevalence of Uncontrolled Risk Factors for Cardiovascular Disease: United States, 1999-2010"
So, the good news is, there is a decreasing trend, and the not-so-good-news is, about 1/2 of all men, and 1/2 of women over the age 40 of still have uncontrolled risk factors for cardiovascular disease. Lots of room for improvement. For more information, see Cardiovascular Disease, and Cerebrovascular Disease |

1 Significantly different from 1999 to 2000, p < 0.05. NOTES: Parts may not sum to total due to rounding. SOURCE: CDC/NCHS, National Health Interview Survey Graphic source: http://www.cdc.gov/nchs/data/databriefs/db100.htm |
According to the July 2012 "NCHS Data Brief Number 100, July 2012, Multiple Chronic Conditions Among Adults Aged 45 and Over: Trends Over the Past 10 Years":
|

1 Significantly different from 1999 to 2000, p < 0.05. SOURCE: CDC/NCHS, National Health Interview Survey. Graphic source: http://www.cdc.gov/nchs/data/databriefs/db100.htm |
Here is the reality of what we are dealing with today. According to the July 2012 "NCHS Data Brief
Number 100, July 2012, Multiple Chronic Conditions Among Adults Aged 45 and Over: Trends Over the Past 10 Years":
For additional information, see Chronic Disease |

Graphic source: http://www.cdc.gov/nchs/data/databriefs/db100.htm |
According to the CDC:
Note, for these analyses the chronic diseases & conditions include: Hypertension, heart disease, diabetes, cancer, stroke, chronic bronchitis, emphysema, current asthma, and kidney disease. |

Graphic source: American Association for Clinical Chemistry |
According to the 2009 American Association for Clinical Chemistry's "Rates of Chronic Disease Expected to Rise Sharply" that reported on the findings of the Partnership to Fight Chronic Disease, The Impact of Chronic Disease on U.S. Health and Prosperity: A Collection of Statistics and Commentary,
|
According to JAMA's "The Global Burden of Chronic Diseases" (2011)
For more information, see Chronic Diseases

Graphic source: http://www.who.int/healthinfo/global_burden_disease/global_health_risks/en/index.html |
According to WHO's 2009 report,"GLOBAL HEALTH RISKS
Mortality and burden of disease attributable to selected major risks">
|

Graphic source: http://www.prb.org/Articles/2007/GrowingGlobalChronicDiseaseEpidemic.aspx |
In Population Reference Bureau 2007's "The Growing Global Chronic Disease Epidemic," Cohn reports:
|
 Graphic source: http://www.dcp2.org/pubs/GBD Graphic source: http://www.dcp2.org/pubs/GBD |
According to the Disease Control Priorities Project's "The Growing Burden of Noncommunicable Diseases"
|
The first full week of April has been declared National Public Health Week (NPHW) since 1995. It's nice to have one week devoted to celebrating the importance of Public Health. For more information, see The Basics of Public Health and Public Health Practice

Graphic source: http://www.howtogeek.com/135213/antarctica-land-of-the-complicated-time-zones/ |
According HowtoGeek.com, "Although logically Antartic, situated at the Earth's southern pole, should have a bit of each longitudinally defined time zone in it. Instead, the scarcely population continent is a patchwork quilt of time zones dependent upon which country claims territorial rights there and/or which research stations are active in each section." (Source: http://www.howtogeek.com/135213/antarctica-land-of-the-complicated-time-zones/)
If you think this is weird, the most populous country in the world, China, has only one time zone! Now you know! |

Graphic source: http://kacen.myblog.it/index-20.html |
After spending the past couple of weeks of blog postings looking at COPD, I would like to end this mini-series with this graphic.
Obviously, the most effective intervention throughout the course of the disease is smoking cessation. The best news it COPD can be prevented simply by not smoking. And, for those who smoke, quit. For more information about the health effects of smoking, and smoking cessation resources, see Tobacco  |

Map source: http://www.cdc.gov/diabetes/statistics/diabetes_slides.htm |
According to the MMWR:
For more information, see Diabetes Resources on the Net |

Graphic source: http://www.quit-smoking-guides.com/images/Stop-Smoking-Aids.jpg

Graphic source: http://pinterest.com/pin/253609022737930522/
For additional information, see Lung Diseases
|
|
According to the CDC, "Chronic obstructive pulmonary disease (COPD) causes substantial morbidity and mortality and may be unrecognized in its early stages. Chronic lower respiratory disease (CLRD), which includes both COPD and asthma, was the third leading cause of death in the United States in 2008.
COPD includes chronic bronchitis and emphysema, which both make emptying air from the lungs progressively more difficult and can be associated with cough, mucus production, wheezing, and breathlessness. Risk factors include primarily cigarette smoking, but also exposure to noxious particles or gases, recurrent infection, diet, and genetic factors. COPD is often preventable, but there is no cure. Treatment can control symptoms and slow disease progression." It should be noted that when the CDC presents trends in COPD prevalence, hospitalization and death rates, "Asthma is excluded from this report because it is considered a different condition with fully reversible symptoms, although some people may have asthma and COPD concurrently."
For more information, see Lung Diseases American Lung Association's Chronic Obstructive Pulmonary Disease (COPD) Fact Sheet |
|
|
According to the CDC, "Prevalence of COPD was stable from 1998 through 2009 and was significantly higher among women than men.
|

Graphic source: http://www.cdc.gov/nchs/data/databriefs/db63.htm |
As you can see, chronic lower respiratory diseases are variously defined and this may be problematic in comparing statistics. Since the CDC seems to be concentrating on chronic obstructive pulmonary disease (COPD), we might as well start with that and find out what we really know about COPD.
According to the CDC, Prevalence of COPD was higher in older age groups, and women had higher rates than men throughout most of the lifespan.
|
|
Number of Deaths from 10 Leading Causes National Vital Statistics System, United States, 2006-2007
|
I decided to explore further about the rising deaths from chronic lower respiratory diseases. Apparently it occurred some time between 2007 - 2008, or thereabouts. Nevertheless, this is worth monitoring even though most of our attention is taken up with heart disease and cancer, which are still responsible for the bulk of US deaths.
Unfortunately, I had a hard time finding one single definition for "Chronic Lower Repiratory Diseases." It appears that various entities use a variant of disease classifications to define this group of diseases. Therefore, I am presenting what I was able to find, and you can see for yourself that the definition of "Chronic Lower Respiratory Diseases" will need to be more precise in order to truly understand what we are dealing with. The West Virginia Health Statistics Center: "Chronic Lower Respiratory Disease (CLRD) is a serious illness affecting millions of people. CLRD actually comprises three major diseases, i.e., chronic bronchitis, emphysema, and asthma, that are all characterized by shortness of breath caused by airway obstruction. The obstruction is irreversible in chronic bronchitis and emphysema, reversible in asthma. Before 1999, CLRD was called Chronic Obstructive Pulmonary Disease (COPD). The International Classification of Diseases used by the World Health Organization (WHO) to code diseases and mortality was revised in 1999, with slight changes to the category between the 9th and 10th editions. CLRD is used to refer to chronic bronchitis, emphysema, and asthma." (Citation source: http://www.wvdhhr.org/bph/hsc/pubs/other/clrd/national.htm) Missouri Health Department: "Chronic Lower Respiratory Disease. Resident deaths for which the underlying cause of death was given on the death certificate as chronic obstructive pulmonary disease and allied conditions. This category is called "chronic lower respiratory diseases" in the National Center for Health Statistics' current listing of leading causes of death. Included are: Bronchitis (unless it is specified as acute bronchitis), emphysema, asthma, bronchiectasis, and chronic airway obstruction not elsewhere classified. The vast majority of the deaths in this category are attributed to "Chronic airway obstruction not elsewhere classified." For data through 1998, International Classification of Diseases (ICD-9) codes 490-494, and 496. (Profiles ending 1998 or earlier were based on a slightly different definition; effective with the ICD-10 revision, ICD-9 code 495 [extrinsic allergic alveolitis] is no longer included. This affects few, if any, Missouri resident deaths per year.) For data years 1999 forward, International Classification of Diseases (ICD-10) codes J40-J47. (Citation source: http://health.mo.gov/data/mica/CDP_MICA/CofDDefinitionofIndicators.html) Tarrant County Texas uses:
The CDC defines "Chronic obstructive pulmonary disease (COPD) includes chronic bronchitis and emphysema but has been defined recently as the physiologic finding of nonreversible pulmonary function impairment." (Citation source: http://www.cdc.gov/mmwr/preview/mmwrhtml/ss5106a1.htm) "Chronic obstructive pulmonary disease (COPD) is a heterogeneous group of slowly progressive diseases characterized by airflow obstruction that interferes with normal breathing. In 2005, approximately one in 20 deaths in the United States had COPD as the underlying cause. Smoking is estimated to be responsible for at least 75% of COPD deaths." (Citation source: http://www.cdc.gov/mmwr/preview/mmwrhtml/mm5745a4.htm) It seems the CDC is concentrating on chronic obstructive pulmonary diseases that exclude asthma, which is included in other definitions of chronic lower respiratory diseases. For more information, see Chronic Obstructive Pulmonary Disease (COPD) Includes: Chronic Bronchitis and Emphysema For additional information, see Tobacco and Smoking Cessation Information |
|
|
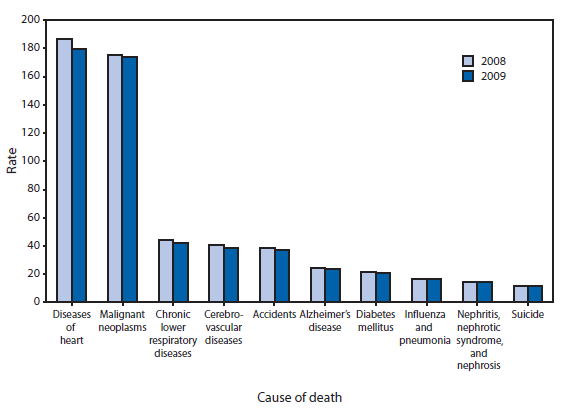
On March 1st, the CDC released its "QuickStats: Number of Deaths from 10 Leading Causes National Vital Statistics System, United States, 2010" (Weekly
March 1, 2013 / 62(08);155)
"In 2010, a total of 2,468,435 deaths occurred in the United States. The first two leading causes of death, heart disease (597,689 deaths) and cancer (574,743), accounted for nearly 50% of all deaths. In contrast, the other leading causes accounted for much smaller percentages, ranging from 5.6% (138,080 deaths) for the third leading cause of death, chronic lower respiratory disease, to 1.6% (38,364) for suicide, the 10th leading cause of death. All other causes combined accounted for 25% of the deaths."
Compare this to the mortality statistics reported in 2007, at which time, 135,952 stroke deaths were reported (6%), and 127,924 chronic lower respiratory disease deaths were reported (5%). (National Prevention Strategy, June 2011, p. 13). The 2010 data are showing that more people are dying from chronic lower repiratory diseases than from strokes. For most people this bar chart has not changed much. Heart disease still remains the leading cause of death, followed by cancer However, to me, and those who track trends, this shows a major change - chronic lower respiratory diseases has replaced stroke as the third leading cause of death in the U.S. |

Graphic source: http://www.faithandhealthconnection.org/americas-plan-for-better-health-and-wellness/ |
"The National Prevention Strategy: America's Plan for Better Health and Wellness
On June 16, 2011 the National Prevention, Health Promotion, and Public Health Council, announced the release of the National Prevention Strategy (PDF, 1.81 MB), a comprehensive plan that will help increase the number of Americans who are healthy at every stage of life. The National Prevention Strategy recognizes that good health comes not just from receiving quality medical care, but also from clean air and water, safe outdoor spaces for physical activity, safe worksites, healthy foods, violence-free environments and healthy homes. Prevention should be woven into all aspects of our lives, including where and how we live, learn, work and play."
|
 Graphic source: http://cordexagri.wordpress.com/2012/05/16/baler-twine-cordexagri-infographic-united-states-of-the-environment/ |
Finally, some good news. Every state gets to be good at something. This is based on numerous data sources.
Citation source: http://cordexagri.wordpress.com/2012/05/16/baler-twine-cordexagri-infographic-united-states-of-the-environment/ |
 Graphic source: http://cordexagri.wordpress.com/2012/05/16/baler-twine-cordexagri-infographic-united-states-of-the-environment/ |
Here's a map that highlights the worst environmental hazards for each state.
Citation source: http://cordexagri.wordpress.com/2012/05/16/baler-twine-cordexagri-infographic-united-states-of-the-environment/ |
 Graphic source: http://ecolocalizer.com/2012/03/13/causation-or-correlation-comparing-us-obesity-mcdonalds-location-maps/ |
Here are the location of McDonalds restaurants across the continental US? Hmmm, could there be some connection to the rising rates of obesity and diabetes? However, you can't blame it all on them. We need to take some responsibility for our health and wellness.
|

For more information, see AIDS/HIV
 Graphic source: http://bettylamarrshow.blogspot.com/2012/08/the-betty-lamarr-show-diabetes-in-mid.html |
Of all the maps I have presented this week, this one is perhaps the saddest one of all. It shows how out of shape the country is. As obesity is increasing over time, so it diabetes.
|
 Graphic source: http://www.cdc.gov/pcd/issues/2007/oct/07_0091.htm |
According to the CDC's "The Topography of Poverty in the United States: A Spatial Analysis Using County-Level Data From the Community Health Status Indicators Project" - "The distinctive north-south divide across most of the United States, in which concentrations of low poverty and spatial outliers of high poverty are confined to the northern half, and concentrations of high poverty and spatial outliers of low poverty are confined to the southern half, is termed the continental poverty divide. Data source: Community Health Status Indicators.
Citation source: http://www.cdc.gov/pcd/issues/2007/oct/07_0091.htm |
 Graphic source: http://colinwoodard.blogspot.com/2012/04/presenting-slighty-revised-american.html |
This map was updated 4/2012 by Colin Woodard, the creator of this map, and the author of "American Nations." Chronicle Review's (6/25/2012) "Running for President on a Divided Continent" took a look at our country's diversity:
Now think about how challenging this is for public health practitioners and how every message, regardless of how simple can become so complex that there is a risk that no one will get the same message. For sure, cultural competency will become, if not already, THE mantra for Public Health in the 21st century. |

Graphic source: http://www.aaanativearts.com/us_tribes_AtoZ.htm |
As you can see, depending on who you ask, the U.S. can be mapped quite diferently than the map you saw yesterday. Here is how Native Americans see the U.S. They were, after all, here before everyone else started arriving.
|
 Graphic source: http://www.lawpundit.com/blog/2008/10/blawg-review-180.htm |
As you know by now, I simply love maps! Here is one that shows the distribution of Americans, by ancestry. For sure, we are a nation of diverse ancestries!
|

Graphic source;http://www.cdc.gov/SocialMedia/Tools/guidelines/ |
Even though the emphasis these days is on the visual, writing remains an important skill all public health professionals to have. Since communication is a vital strategy in addressing many public health issues, how the message is relayed can make a huge difference.
Released in April, 2012, CDC's Guide to Writing for Social media is an excellent resource for making the most of the Internet's capacity to reach millions. Here you will find all the basics for written communication and how to translate this to social media. Just click on the graphic to access the guide. For additional information on social media, see Public Health Practice |

Graphic source http://www.marketingcharts.com/wp/interactive/popular-socnet-sites-prove-appealing-to-varying-demographics-27040/attachment/pew-social-media-user-demographics-feb2013/ |
Here are some stats fom Pew Research Center's Internet and American Life Project. They have now identified which subpopulations are using which kind of social networking site. Eventually there will be be very little these companies won't know about us. |

Graphic source: http://www.cvd.idf.org/Risk_Factors/index.html |
According to the CDC, risk factors for heart disease include "High blood pressure, high LDL cholesterol, and smoking are key risk factors for heart disease. About half of Americans (49%) have at least one of these three risk factors."
Several other medical conditions and lifestyle choices can also put people at a higher risk for heart disease, including:
|

According to the American Academy of Family Physicians, "Global CHD risk is the absolute risk of a CHD-related event over a specific period, usually 10 years. The event can be hard (e.g., myocardial infarction [MI], sudden cardiac death) or soft (e.g., chest pain). The risk estimate is based on major risk factors and is calculated using an empiric equation. In contrast, the conventional clinical approach to primary prevention of cardiovascular disease relies on identification and treatment of individual risk factors, such as hypertension and hyper-lipidemia. However, this approach does not account for the fact that major cardiovascular risk factors contribute multiplicatively to overall CHD risk. In addition, physicians tend to observe rather than treat small elevations in risk factors."


Graphic source: http://mchb.hrsa.gov/whusa04/pages/ch2.htm |
Those these stats are from HRSA's "Women's Health USA 2004", it does show that the rate of heart disease among women differ by race and ethnicity. U.S. white and black women have the highest rates, when compared to women of other races. Citation source: http://mchb.hrsa.gov/whusa04/pages/ch2.htm |

Graphic source: http://www.cdc.gov/dhdsp/data_statistics/fact_sheets/fs_women_heart.htm |
Here is a CDC map of heart disease among women, based on Behavioral Risk Factor Surveillance System data. According to the CDC:
For more information, see Women and Heart Disease |

Graphic source: http://www.nhlbi.nih.gov/resources/docs/2012_ChartBook_508.pdf |
"The Morbidity & Mortality: Chart Book on Cardiovascular, Lung, and Blood Diseases is a biennial compilation of data on the size and trends of morbidity and mortality from the cardiovascular, lung, and blood diseases. While most charts describe national prevalence, hospitalizations, and mortality statistics, some of them provide additional information by state or country. Risk factors estimates and the economic costs of these diseases are also included."
From this resource you will learn that 2008 mortality statistics show that if you look at deaths by race and ethnicity, cancer is the leading cause of death for Asian males and females, Hispanic females and American Indian females, not heart disease. (pp. 14-17). So, it really is necessary to look at mortality by race and ethnicity to tease out the health disparities that exist. |

Graphic source: http://cfpub.epa.gov/eroe/index.cfm?fuseaction=detail.viewInd&lv=list.listbyalpha&r=235292&subtop=381 |
According to the EPA,"Both coronary heart disease and stroke mortality have been declining over time in each of the 10 EPA Regions (Exhibits 5-25 and 5-26). In 1979, coronary heart disease and stroke age-adjusted mortality rates ranged from 285.6 (Region 10) to 401.9 (Region 2) per 100,000 and 80.3 (Region 2) to 111.4 (Region 4) per 100,000, respectively. In 1998, coronary heart disease and stroke mortality rates ranged from 145.6 (Region 8) to 233.2 (Region 2) per 100,000 and 43.2(Region 2) to 68.5 (Region 10) per 100,000, respectively. The decreases in coronary heart disease and stroke mortality also appear to continue in the 1999-2007 period across all EPA regions. In 1999, coronary heart disease and stroke age-adjusted mortality rates ranged from 140.4 (Region 8) to 234.8 (Region 2) per 100,000 and 43.8 (Region 2) to 72.8 (Region 10) per 100,000, respectively. In 2007, coronary heart disease and stroke mortality rates ranged from 95.2 (Region 8) to 159.2 (Region 2) per 100,000 and 30.3 (Region 2) to 49.8 (Region 6) per 100,000, respectively.
Differences exist in CVD mortality rates among gender, racial, and age groups. For example, in 2007, those age 65 and older had the highest CVD (all types), coronary heart disease, and stroke mortality (1,633, 818.6, and 287.6 per 100,000, respectively). For the same year, the age-adjusted CVD, coronary heart disease, and stroke mortality rates for those 45 to 64 years of age were 161.1, 89.2, and 21.4 per 100,000, respectively. Notable differences in CVD (all types) and, specifically, coronary heart disease mortality rates exist between males and females, but not for stroke mortality. Coronary heart disease mortality among males in 2007 was 165.4 per 100,000, compared to 95.7 per 100,000 for females. In 2007, black or African American males had the highest CVD mortality rate (403.5 per 100,000) compared to white males (292.7 per 100,000), black or African American females (284.2 per 100,000), and white females (204.6 per 100,000). The lowest CVD mortality rates were observed for Asian or Pacific Islander females (125.5 per 100,000) followed by Asian or Pacific Islander males (174.8 per 100,000). (Data not shown.) "
Citation source: http://cfpub.epa.gov/eroe/index.cfm?fuseaction=detail.viewInd&lv=list.listbyalpha&r=235292&subtop=381 |

Graphic source: http://cfpub.epa.gov/eroe/index.cfm?fuseaction=detail.viewInd&lv=list.listbyalpha&r=235292&subtop=381 |
According to the EPA, "In 1998, the national age-adjusted CVD mortality rate (all types) was 352.0 per 100,000 compared to a rate of 541.0 per 100,000 in 1980 (Exhibit 5-24). This decline continues after 1999, with the rate dropping from 349.3 per 100,000 in 1999 to 249.9 per 100,000 in 2007. Mortality rates for coronary heart disease, stroke, and myocardial infarction subcategories of CVD have also declined between 1979 and 1998. The age-adjusted coronary heart disease mortality rate ranged from 345.2 per 100,000 in 1980 to 197.1 per 100,000 in 1998. For stroke mortality, the age-adjusted rate ranged from 97.1 per 100,000 in 1979 to 59.3 per 100,000 in 1998. The age-adjusted mortality rates for myocardial infarction ranged from 157.9 in 1979 to 76.0 per 100,000 in 1998. The decline in mortality from these three CVD subgroups continued to be observed between 1999 and 2007. The age-adjusted mortality rates for coronary heart disease, stroke, and myocardial infarction in 2007 were 126.0, 42.2, and 41.4 per 100,000, respectively, compared to 194.6, 61.6, and 73.2 per 100,000, respectively, in 1999. In contrast, mortality attributed to hypertension has slightly increased between 1999 and 2007 from 15.8 per 100,000 to 17.8 per 100,000."
Citation source: http://cfpub.epa.gov/eroe/index.cfm?fuseaction=detail.viewInd&lv=list.listbyalpha&r=235292&subtop=381 |

Graphic source: http://circ.ahajournals.org/content/125/1/e2/F30.expansion.html |
American Heart Association's Statistical Update - Heart Disease and Stroke Statistics 2012 Update offers the latest U.S. cardiovascular statistics. Here's is an example of the kind of data they report. Here are U.S. maps depicting age-adjusted mortality rates for cardiovascular diseases, coronary heart disease and stroke. Such maps help to identify those states with greater number of deaths for disease categories. For example, southern states have the highest stroke mortality rates. |
A Community of Contrasts Report
Don't know much about Asian Americans? You're not the only one. So, the Asian American Center for Advancing Justice released it demographic report, A Community of Contrasts: Asian Americans in the United States, 2011. This report analyzes Census and other data on Asian Americans at the national level and highlights key issues facing the nation's fastest growing racial group. Some key facts include:


Graphic source: http://circ.ahajournals.org/content/125/1/e2.figures-only |
American Heart Association's Statistical Update - Heart Disease and Stroke Statistics 2012 Update offers the latest U.S. cardiovascular statistics.
Here is an example of the kind of data they report. This one is about the incidence of cardiovascular disease by gender. The incidence of cardiovascular disease increases as we get older. While men surpass women in every age group, the incidence of CVD increases for women as well as they get older. |

Graphic source: http://cfpub.epa.gov/eroe/index.cfm?fuseaction=detail.viewInd&lv=list.listbyalpha&r=235292&subtop=381 |
According to the EPA, "Among adults 18 years and older, the prevalence of heart disease and stroke between 1997 and 2009 has remained essentially the same (Exhibit 5-23). In contrast, the prevalence of hypertension has shown a general increase from 191 cases per 1,000 in 1997 to 249 cases per 1,000 in 2009.
Gender, race, and age differences in CVD prevalence exist. The prevalence of coronary heart disease is consistently higher among males than among females (81.1 cases per 1,000 for men compared with 49.6 cases per 1,000 for women in 2009). In contrast, hypertension is more prevalent among women (252.3 cases per 1,000 for women compared with 245.2 per 1,000 for men in 2008); however, the gap is narrowing as rates for men have been increasing at a faster pace over time compared to women. Among the racial groups reported, American Indians and Alaska Natives had the highest prevalence of coronary heart disease between 1999 and 2001. In 2009, whites had the highest prevalence of coronary heart disease (67.9 cases per 1,000), followed by blacks or African Americans (59.8 cases per 1,000), Asians (32.2 cases per 1,000), and American Indians and Alaska Natives (31.8 cases per 1,000). Between 1999 and 2009, Asians consistently had the lowest prevalence of stroke (9.8 cases per 1,000 in 2009) and hypertension (175.8 cases per 1,000 in 2009) among the racial groups reported."
|
 |
Heart disease is an international health issue. According to the World Health Organization (WHO), "An estimated 17 million people die of CVDs, particularly heart attacks and strokes, every year. A substantial number of these deaths can be attributed to tobacco smoking, which increases the risk of dying from coronary heart disease and cerebrovascular disease 2-3 fold.
Physical inactivity and unhealthy diet are other main risk factors which increase individual risks to cardiovascular diseases. One of the strategies to respond to the challenges to population health and well being due to the global epidemic of heart attack and stroke is to provide actionable information for development and implementation of appropriate policies. As part of such efforts, WHO in collaboration with the US Centers for Disease Control and Prevention (CDC) has produced for the wider audience, "The Atlas of Heart Disease and Stroke."" Citation source: http://www.who.int/cardiovascular_diseases/resources/atlas/en/ This atlas provides a wealth of information about heart disease and stroke, including good coverage of all the risk factors contributing to heart disease. Check out the coverage about Obesity as a heart disease risk factor. Just click on the graphic to get to the atlas. |

Graphic source: http://www.who.int/cardiovascular_diseases/publications/ atlas_cvd/en/index.html |
The World Health Organization's "The Global Atlas on cardiovascular disease prevention and control" is an excellent document that comprehensively covers the epidemiology of cardiovascular disease around the world. It has a wealth of maps and graphs about the distribution of heart disease around the world. Definitely check it out. Just click on the graphic to get to the atlas. |
For more information, see Cardiovascular Disease and Women and Heart Disease


Graphic source: http://idisaster.wordpress.com/2011/04/13/5-ways-to-pump-up-your-em-facebook-presence/ The lines are blurring between what is consider "Public" vs. "Private". It is not unusual to see people spill their life history online. You know what I am talking about. Social network sites think nothing about having you spill your guts for the world to see. sometimes I cringe at the personal nature of some of the postings I see online. Anonymous postings are even worse. Nevertheless, posting anything online could mean an immortality we never bargained for. Just keep in mind that "someone" is using all this information to make money, without having to pay for that information.Gathering this kind of information used to be in the purview of marketing research. Just think of all the marketing researchers out of jobs because so many people willingly give away personal information for nothing. And then you wonder why you have been targeted by advertisers who seem to know so much about you! |
So, exactly where do you draw the line? Where does your private persona end and your public persona begin? Then again, is your virtual avatar the real you? Let the philosophers deal with that one. Then again, we really do need to think about our lives on a philosophical level every now and then. It's call reflection, and I don't think we do quite as much as we should do to bring meaning into our lives. We spend our time multi-tasking to the detriment of our mental and physical health. We waste entirely too much time doing social networking to the neglect of the people who are actually here and will be there for you. We eventually find that 1,500 online friends can never replace the one you happen to be with. This is the reality of the world we live in today. Which brings me to today's blog entry about using social media for public health practice. Yes, I do see value in using social media to promote Public Health. It is really great to see that the CDC has provided "Social Media Guidelines and Best Practices." Basically, this document provides guidance about the more "professional" uses of social media. This is a good thing. While it specifically refers to Facebook because this is the big one, the principles mentioned can be applied to any social network. Additional CDC resources for professional use of social media can be found at CDC Social Media Tools, Guidelines & Best Practices Additional information Public Health Practice |

|
I love Twitter simply because 140 characters is usually enough to get the message across. During 2012 I started using Twitter as a quick way to share Public Heatlh related links I found useful. |


