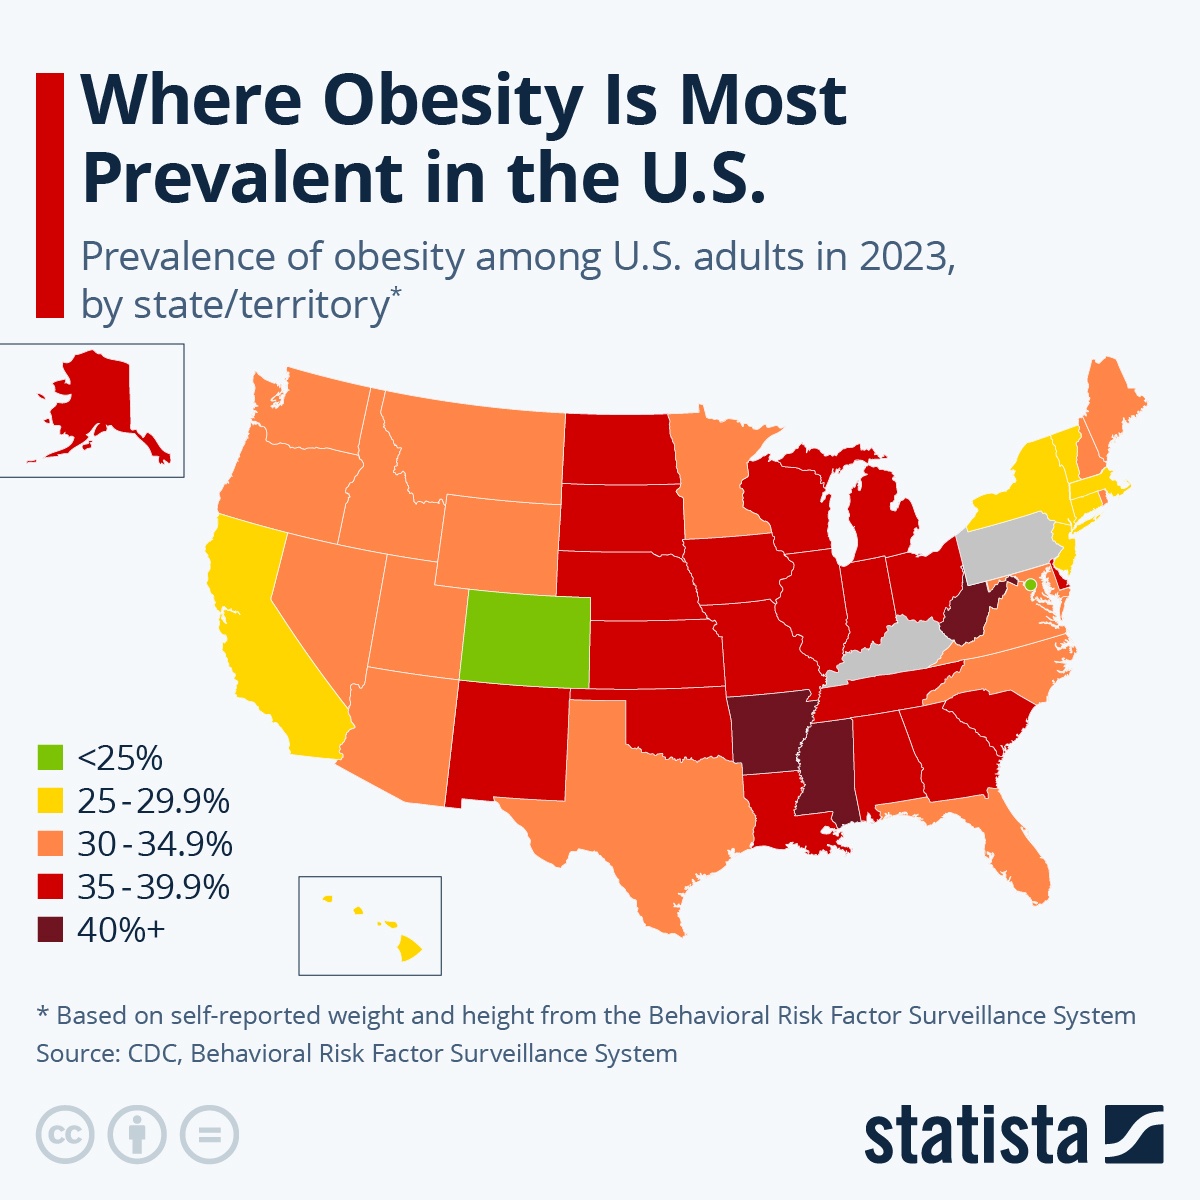
Map source: https://www.cdc.gov/obesity/data/prevalence-maps.html
Trends in age-adjusted obesity and severe obesity prevalence among adults aged 20 and over: United States, 1999–2000 through 2017–2018
Graphic source: https://www.cdc.gov/nchs/products/databriefs/db360.htm
Prevalence of overweight and obesity based on 1990s and late 2010s weight and height data
Graphic source: https://onlinelibrary.wiley.com/doi/10.1111/obr.13128
Prevalence of Self-Reported #Obesity Among, From Left, Non-Hispanic White Adults, Hispanic Adults, and Non-Hispanic Black Adults by State and Territory, BRFSS, 2017-2019 (Source: @CDC News and Notes) #ObesityRaceEthnicity
Graphic source: https://jamanetwork.com/journals/jama/fullarticle/2770158
Graphic source: https://www.tfah.org/report-details/stateofobesity2019/
Self-reported adult obesity prevalence by race, ethnicity, and location using combined 2016-2018 data from the Behavioral Risk Factor Surveillance System.
Graphic source: https://www.cdc.gov/obesity/images/obesity-maps/2018/2018-animated-overall.gif
Prevalence of self-reported #obesity among US adults, by state and territory, Behavioral Risk Factor Surveillance System (BRFSS), 2017.
Graphic source: https://www.cdc.gov/pcd/issues/2019/18_0579.htm
Prevalence of self-reported #obesity among non-Hispanic white, non-Hispanic black, and Hispanic adults, by state and territory, Behavioral Risk Factor Surveillance System, 2015–2017.
Graphic source: https://www.cdc.gov/pcd/issues/2019/18_0579.htm
Graphic source: https://jamanetwork.com/journals/jama/fullarticle/2676543
Graphic source: https://jamanetwork.com/journals/jama/fullarticle/2676543
Prevalence of Overweight, Obesity, and Severe Obesity Among Children and Adolescents Aged 2-19 Years: United States, 1963-1965 Through 2015-2016
Graphic source: https://www.cdc.gov/nchs/data/hestat/obesity_child_15_16/obesity_child_15_16.htm
Prevalence of Overweight, Obesity, and Severe Obesity Among Adults Aged 20 and Over: United States, 1960-1962 Through 2015-2016
Graphic source: https://www.cdc.gov/nchs/data/hestat/obesity_adult_15_16/obesity_adult_15_16.htm
Map source https://www.phi.org/news-events/1503/let-s-get-real-about-obesity-rates-on-the-rise
Graphic source: https://stateofobesity.org/adult-obesity/
Map source:http://www.nejm.org/doi/full/10.1056/NEJMoa1614362#t=article
Trends in obesity prevalence among adults aged 20 and over (age adjusted) and youth aged 2-19 years: United States, 1999-2000 through 2015-2016
Graphic source: https://www.cdc.gov/nchs/products/databriefs/db288.htm
Obesity prevalence among adults, by education level and sex National Health and Nutrition Examination Survey, 1999-2002 to 2011-2014
Graphic source: https://www.cdc.gov/mmwr/volumes/66/wr/mm6650a1.htm
Graphic source: https://stateofobesity.org/adult-obesity/
Graphic source: https://stateofobesity.org/children1017/
Trends in obesity prevalence among adults aged 20 and over (age-adjusted) and youth aged 2-19 years: United States, 1999-2000 through 2013-2014
Graphic source: http://www.cdc.gov/nchs/products/databriefs/db219.htm
Prevalence of obesity among youth aged 2-19 years, by sex and race and Hispanic origin: United States, 2011-2014
Graphic source: http://www.cdc.gov/nchs/products/databriefs/db219.htm
Prevalence of obesity among youth aged 2 - 19 years, by sex and age: United States, 2011 - 2014
Graphic source: http://www.cdc.gov/nchs/products/databriefs/db219.htm
Prevalence of obesity among adults aged 20 and over, by sex and race and Hispanic origin: United States, 2011 - 2014
Graphic source: http://www.cdc.gov/nchs/products/databriefs/db219.htm
Prevalence of obesity among adults aged 20 and over, by sex and age: United States, 2011-2014
Graphic source: http://www.cdc.gov/nchs/products/databriefs/db219.htm
Prevalence of Self-Reported Obesity Among Hispanic Adults by State and Territory, BRFSS, 2013-2015
Graphic source: http://www.cdc.gov/obesity/data/prevalence-maps.html
Prevalence of Self-Reported Obesity Among Non-Hispanic Black Adults by State and Territory, BRFSS, 2013-2015
Graphic source: http://www.cdc.gov/obesity/data/prevalence-maps.html
Prevalence of Self-Reported Obesity Among Non-Hispanic White Adults by State and Territory, BRFSS, 2013-2015
Graphic source: http://www.cdc.gov/obesity/data/prevalence-maps.html
Prevalence of Self-Reported Obesity Among U.S. Adults by State and Territory, BRFSS, 2015
Map source:http://www.cdc.gov/obesity/data/prevalence-maps.html
Notes
Prevalence* of Self-Reported Obesity Among U.S. Adults by State, BRFSS, 2013
Map source: http://www.cdc.gov/obesity/data/prevalence-maps.html
Graphic source: http://www.cdc.gov/obesity/data/adult.html
Graphic source: http://www.rwjf.org/files/images/pr/figures/top10_bottom10_maps_v2-01rev.jpg
Map source: http://www.cnn.com/2017/06/12/health/global-obesity-study/index.html
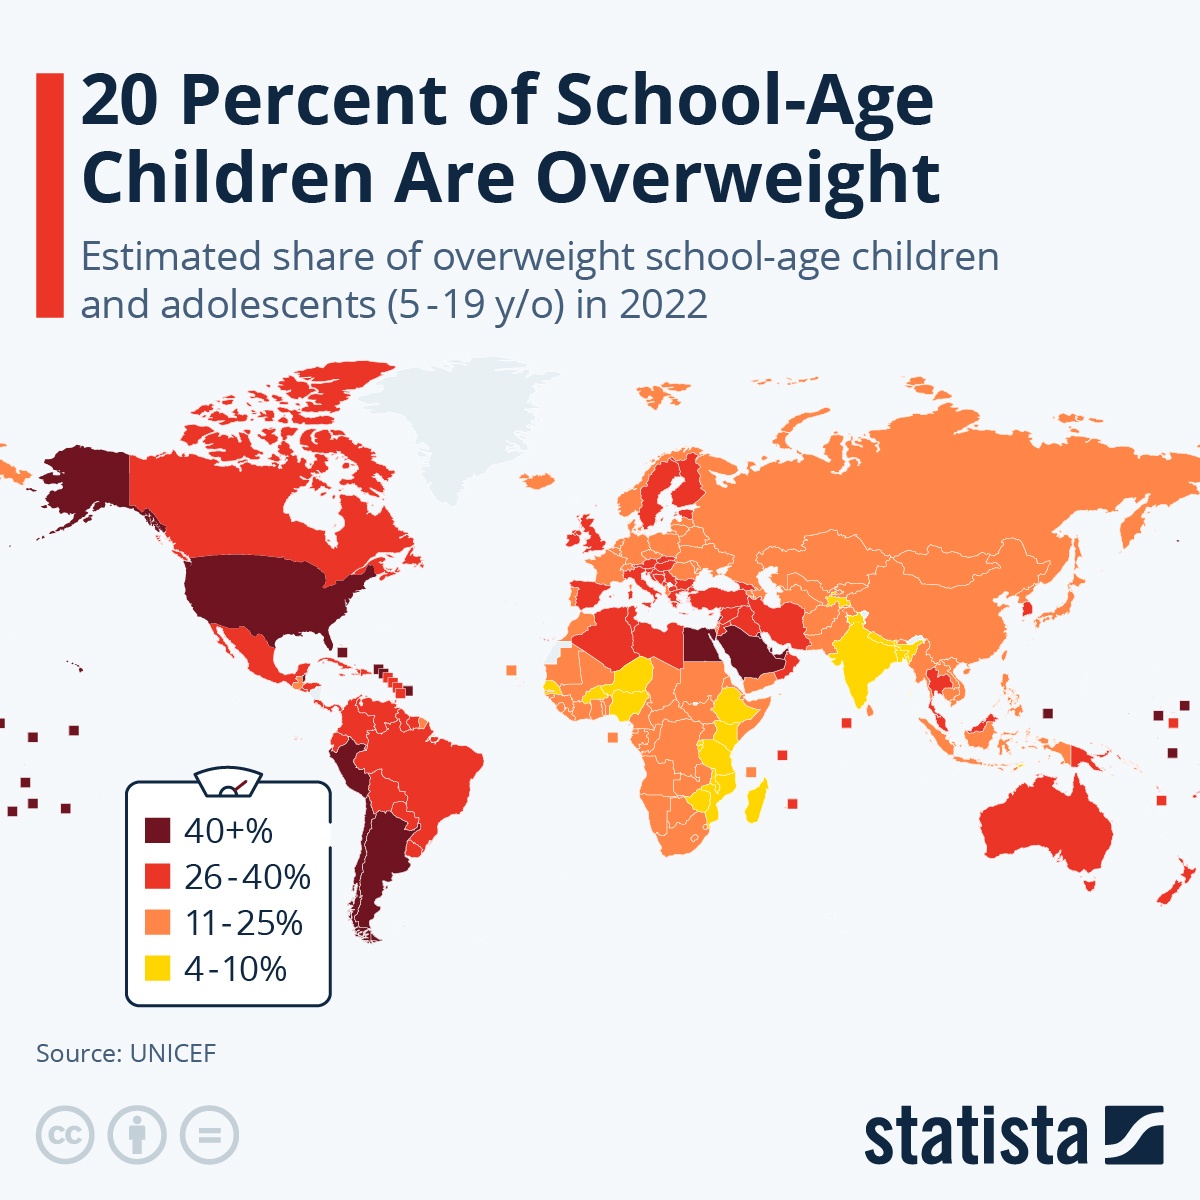
Map source: http://www.thelancet.com/pb/assets/raw/Lancet/stories/commissions/adolescent-health-2016/report_overview_george_presentation.pdf
Graphic source: http://www.vox.com/a/explain-food-america
Obesity over time


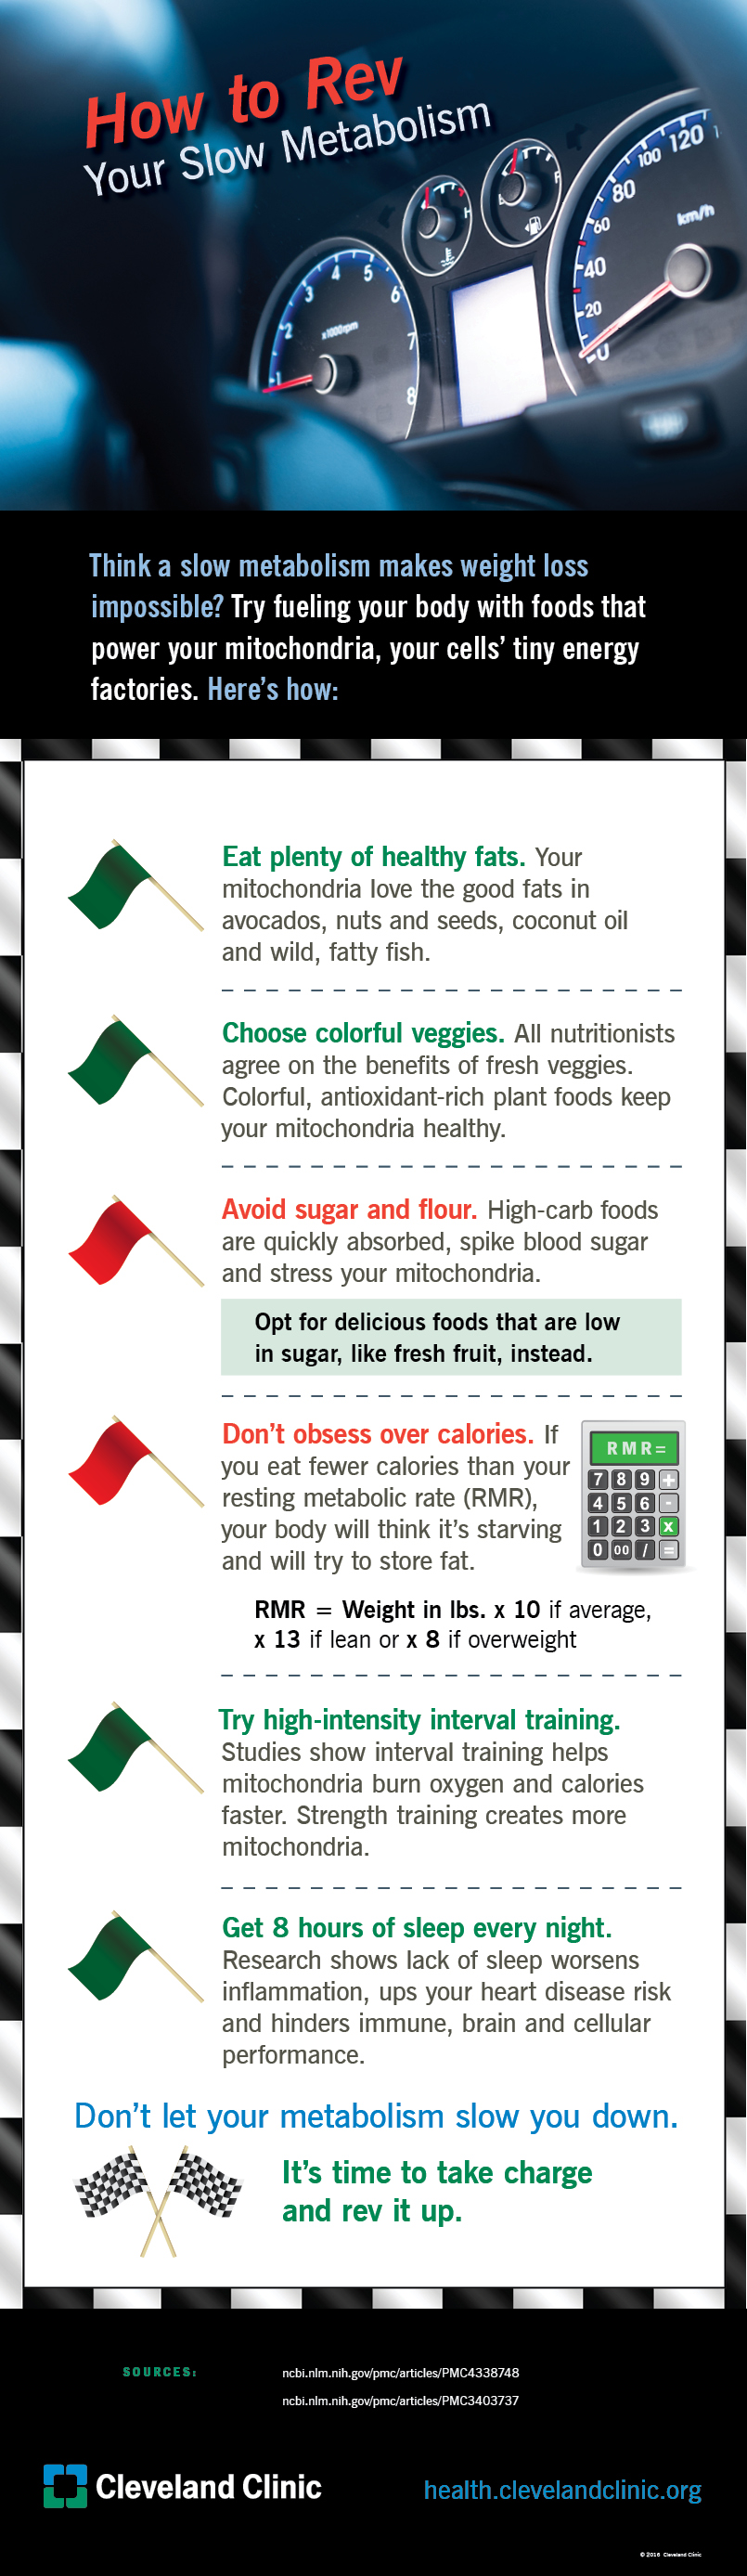
 Getting on Track: Physical Activity and Healthy Eating for Men