Risk charts present these basic facts by showing the chance of dying from a variety of cancer and other diseases over specific time frames. Because age, sex and race are so important in determining your chances, the charts let you account for these factors. While other factors make an important difference (like smoking or having a serious disease run in your family), the numbers from the charts will get you into the right ballpark.
Higher daily step count, but not the pace of the steps (step intensity), was also associated with a lower risk of cancer. Compared with cancer risk in those taking 5,000 steps per day, cancer risk was 11% lower for those taking 7,000 steps per day and 16% lower for those taking 9,000 steps per day. Beyond 9,000 steps, the risk reduction plateaued. The researchers suggested that less physically active individuals may lower their cancer risk by incorporating more walking, at any pace, into their daily routine.
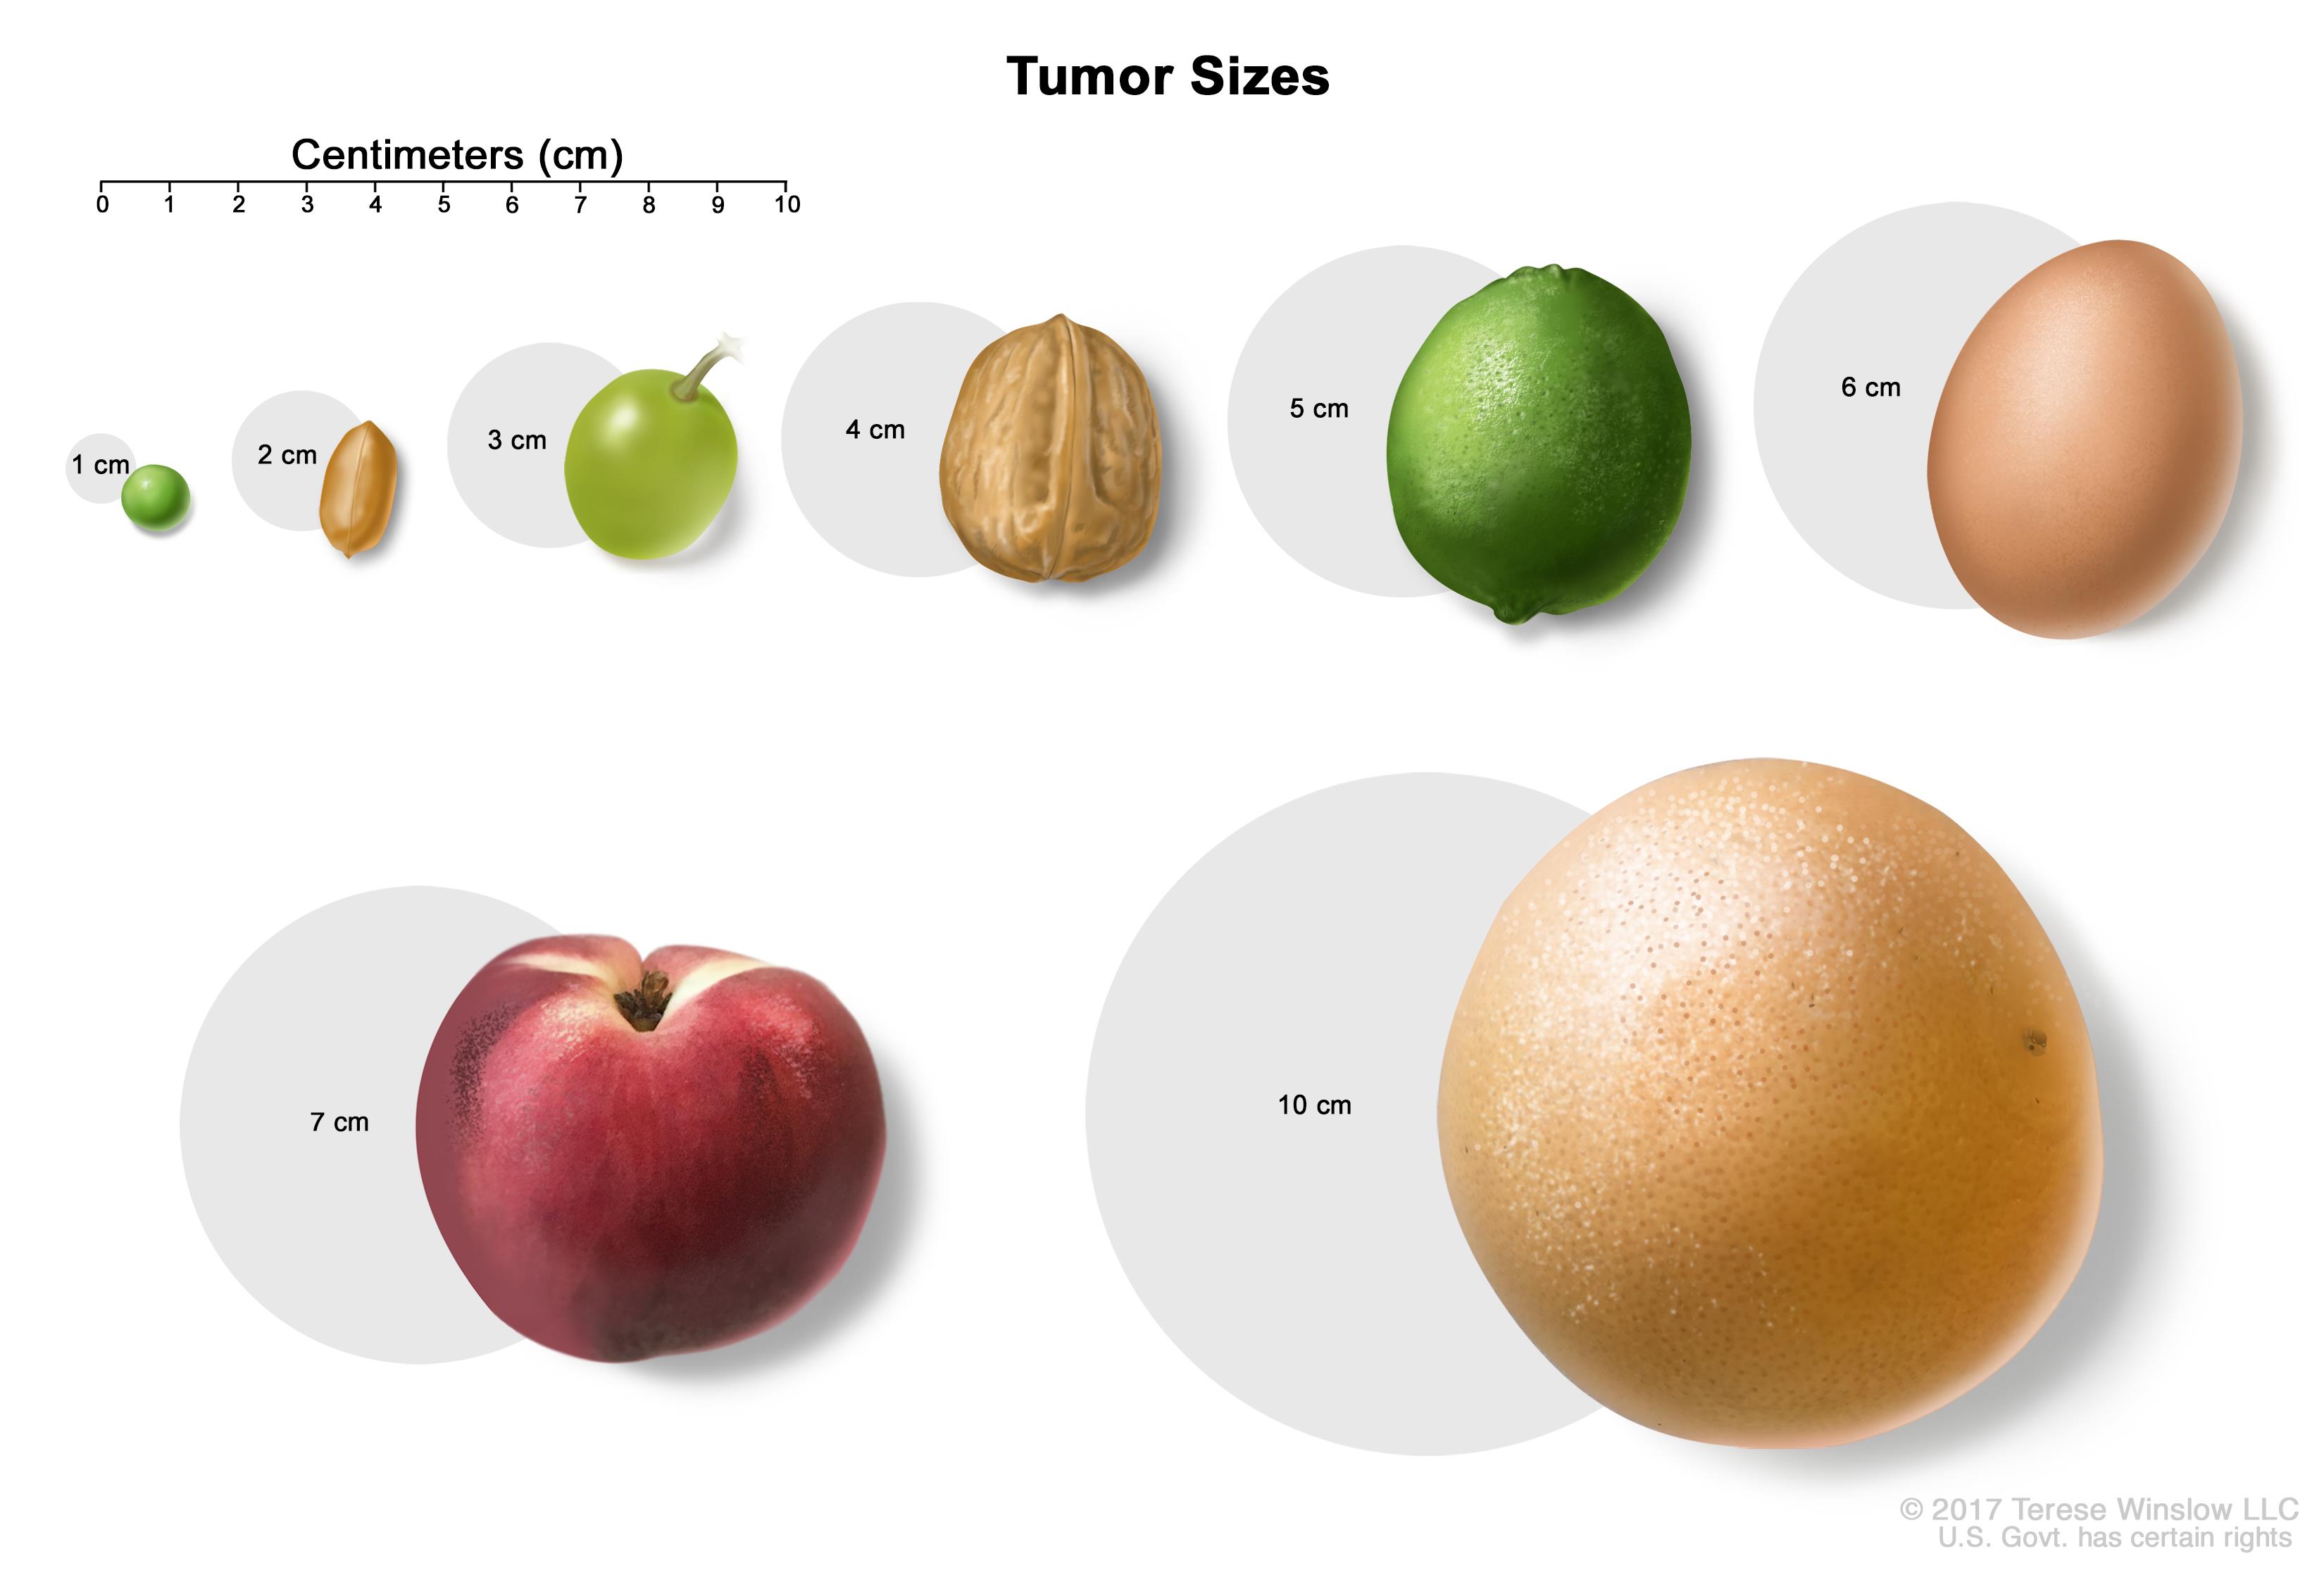
Tumor sizes. The size of a tumor may be compared to the size of a pea (1 cm), peanut (2 cm), grape (3 cm), walnut (4 cm), lime (5 cm), egg (6 cm), peach (7 cm), or grapefruit (10 cm).
Graphic source: https://www.cancer.gov/types/testicular/patient/testicular-treatment-pdq#_1
Map of overall cancer death rate using quintile breaks. Puerto Rico, the Virgin Islands, Guam, American Samoa, and the North Mariana Islands are not shown.
Age-standardized incidence rates and recent trends (five years) for the most common cancers by sex
Graphic source: https://academic.oup.com/jnci/article-lookup/doi/10.1093/jnci/djx030
Age-standardized death rates and recent trends (five years) for the most common cancers by sex
Graphic source: https://academic.oup.com/jnci/article-lookup/doi/10.1093/jnci/djx030
Graphic created by bcjung from: https://www.washingtonpost.com/news/to-your-health/wp/2015/12/14/global-cancer-hotspots-burden-of-disease-is-shifting-to-developing-world/
Changes in five-year relative survival for select childhood cancers (0-14 years), SEER 9*, 1975-2012
Graphic source: https://academic.oup.com/jnci/article-lookup/doi/10.1093/jnci/djx030
Average annual age-adjusted rates* of new cases of common cancers (2009-2013) and deaths from common cancers (2011-2015) in nonmetropolitan and metropolitan counties United States
Age-adjusted rate* of invasive cancer cases, by primary cancer site and state United States, 2013
Graphic source: https://www.cdc.gov/mmwr/volumes/66/ss/ss6604a1.htm
Age-adjusted rate* of cancer deaths, by primary cancer site and state United States, 2013
Graphic source: https://www.cdc.gov/mmwr/volumes/66/ss/ss6604a1.htm
Age-adjusted rate* of invasive cancer cases for most common sites, by sex and race/ethnicity United States, 2013
Graphic source: https://www.cdc.gov/mmwr/volumes/66/ss/ss6604a1.htm