Graphic created by bcjung from source: http://www.cnn.com/2016/09/23/health/heroin-opioid-drug-overdose-deaths-visual-guide/
Graphic created by bcjung from source: http://www.cnn.com/2016/09/23/health/heroin-opioid-drug-overdose-deaths-visual-guide/
Graphic created by bcjung from source: http://www.cnn.com/2016/09/23/health/heroin-opioid-drug-overdose-deaths-visual-guide/
Graphic created by bcjung from source: http://www.npr.org/sections/health-shots/2016/09/09/493130349/college-high-students-are-using-more-marijuana-fewer-opioids
The Drug Index Be Informed. Search for information about a drug. Getsmartaboutdrugs.gov
Substance Abuse Treatment
Graphic source: https://store.samhsa.gov/product/advisory-substance-use-disorder-treatment-people-co-occurring-disorders/pep20-06-04-006
CODs=Co-Occuring conditions with substance use
How long drugs stay in your body (Blood - In Hours; Hair and Urine - In days)
Source: http://finance.yahoo.com/news/heres-long-different-drugs-stay-150000894.html
Map Source: http://www.dtidrugmap.com/
Map graphic created by bcjung from: http://www.nytimes.com/interactive/2016/01/07/us/drug-overdose-deaths-in-the-us.html
APA Position: Because of the lack of any credible studies demonstrating clinical effectiveness, the APA cannot endorse the use of medical cannabis for the treatment of post-traumatic stress disorder (PTSD). The Council on Addiction Psychiatry, the Council on Research, and the Council on Quality Care reviewed available evidence regarding the use of cannabis in the treatment of PTSD and concluded that no published evidence of sufficient quality exists in the medical literature to support the practice. The APA does not endorse cannabis for treatment of PTSD at this time, as further study is needed.
Position Statement Against the Use of Cannabis for PTSD
Kratom: Unsafe and ineffective
Users swear by kratom for mood enhancement and fatigue reduction, but safety issues and questions about its effectiveness abound.
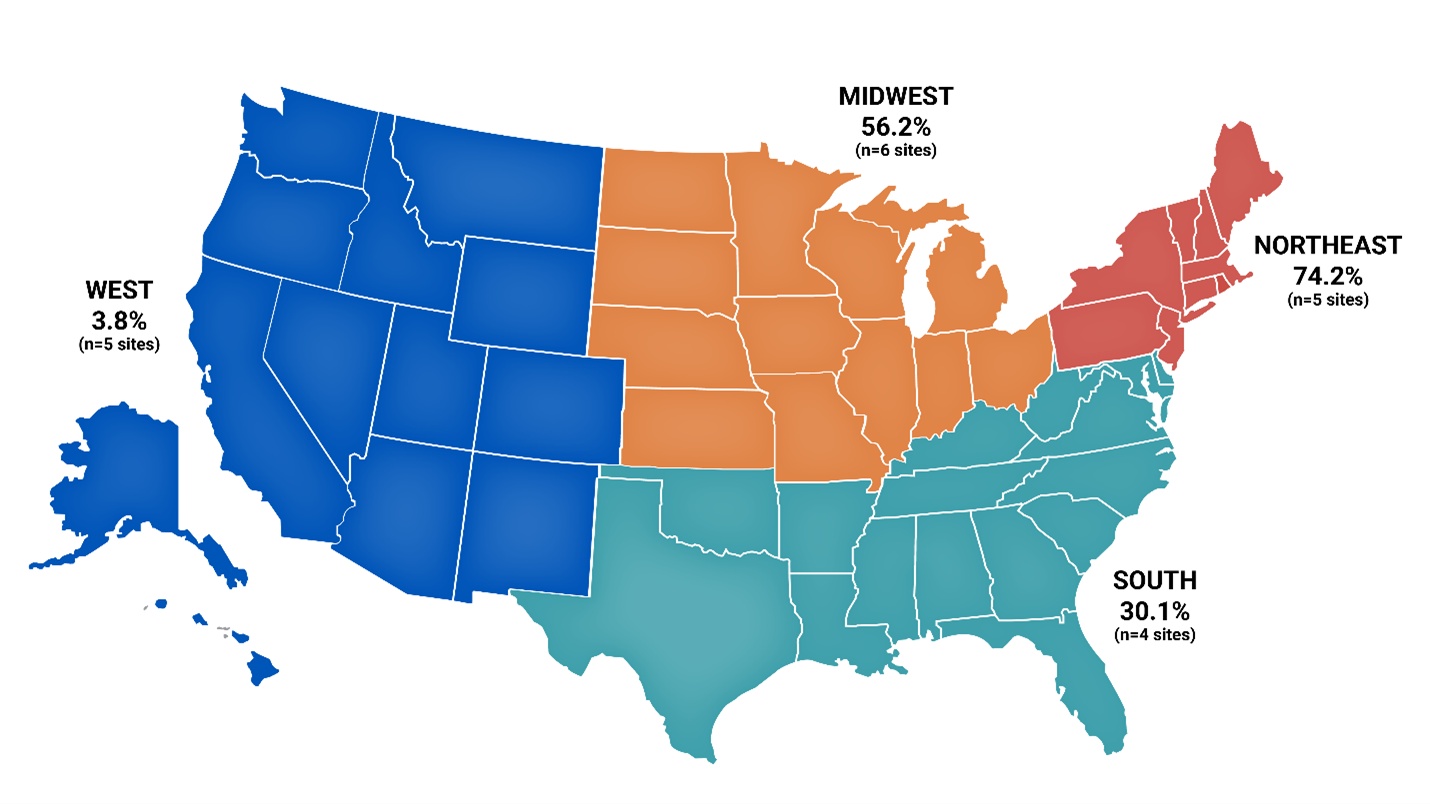
Percentage of opioid-positive drug product and paraphernalia samples also positive for medetomidine across 20 sentinel sitesa: US region, July 2025–December 2025 (Provisional data)b,c
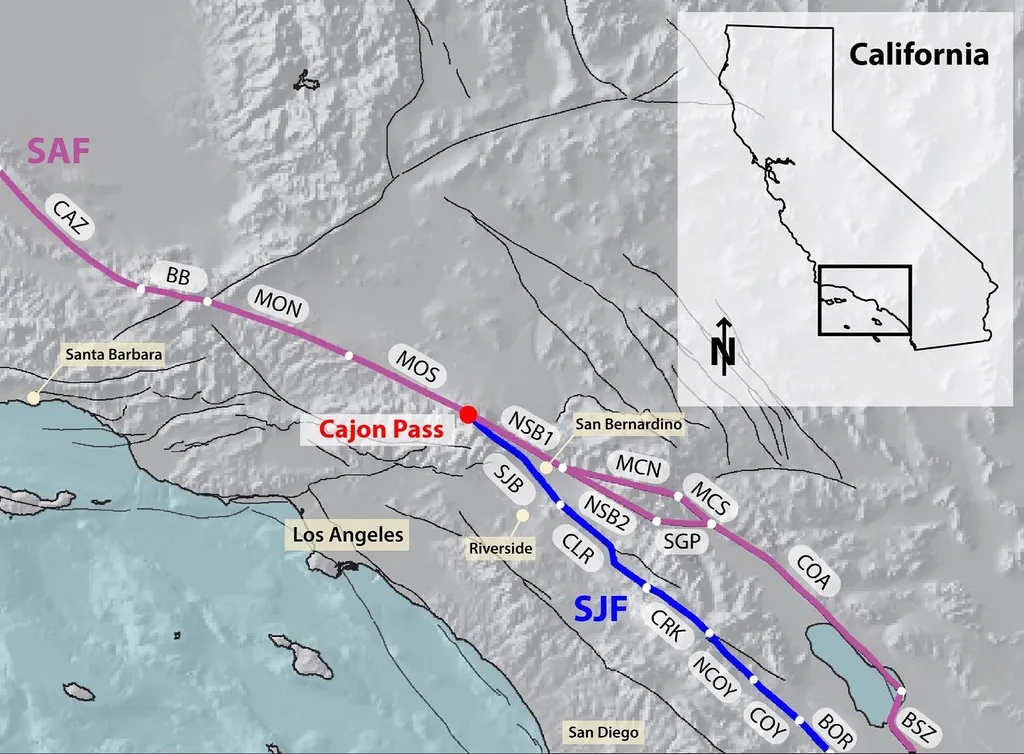
Cajon Pass, where the San Andreas and San Jacinto faults connect, is an "earthquake gate" that can facilitate the spread of ruptures.
(Image credit: Burkhard et al., 2026. JCR Solid Earth. (CC BY 4.0))
At 5:12am on April 18, 1906, a massive #earthquake shook San Francisco, CA. The earthquake ignited several fires that burned for three days and destroyed nearly 500 city blocks. Today we commemorate 118 years of #seismic discovery, research, and resilience. (4/13/2024) @USGS_Quakes
The biggie. #1906SanFranciscoEarthquake This only means one thing - the next one is now past due.
The National Seismic Hazard Model map, displaying the likelihood of damaging earthquake shaking in the United States over the next 100 years. (Image credit: USGS)
The 2026 update to Wildfire Smoke: A Guide for Public Health Officials is now available. The guide provides state, local, and Tribal public health officials with information they need to be prepared for smoke events and, when wildfire smoke is present, to communicate health risks and take measures to protect the public. Although developed for public health officials, the information in this document could be useful to many other groups including health professionals, air quality officials, and members of the public.
The Hunga Tonga-Hunga Ha’apai eruption on January 15, 2022, caused many effects, some illustrated here. The effects were felt around the world and even into space. Image via NASA Goddard/ Mary Pat Hrybyk-Keith.
Graphic source: https://pubmed.ncbi.nlm.nih.gov/26544531/
EDCs can act as obesogens, diabetogens, and/or cardiovascular disruptors. For obesogenic effects, EDCs act upon adipocytes and the brain to induce obesity, which generates insulin resistance, glucose intolerance, and dyslipidemia and greatly increases the susceptibility to T2D and CVDs. Additionally, EDCs work as diabetogens that directly affect the islet of Langerhans and increase or decrease normal insulin biosynthesis and release, generating hyper- or hypoglycemia. An excess of insulin signaling, as well as insulin resistance, can result in metabolic syndrome. In animal models, EDCs induce insulin resistance, glucose intolerance, fatty liver, and dyslipidemia on WAT, liver, and skeletal muscle. This generates T2D and CVDs. The EDC BPA has been shown to act directly on the heart, increasing the probability of CVDs in animal models.
Graphic source: https://pubmed.ncbi.nlm.nih.gov/26544531/
Stages of normal rat mammary gland (MG) development and effects of environment on subsequent events. Different effects and outcomes after EDC exposure are strongly dependent upon the age of exposure (neonatal period, puberty, pregnancy) and time of analysis. Early-life effects such as altered thelarche or gynecomastia present themselves in adolescents, whereas effects on lactation or mammary tumorigenesis become evident during adulthood. Arrows indicate plausible (gray) or more certain (white) mechanistic pathways. Photomicrographs for early life and puberty were all taken at 16× magnification on a macroscope. [Adapted from R. R. Enoch et al: Mammary gland development as a sensitive end point after acute prenatal exposure to an atrazine metabolite mixture in female Long-Evans rats. Environ Health Perspect. 2007;115:541–547 (884), with permission.] Photomicrographs for pregnancy/lactation and adulthood were taken at 10× magnification on a standard microscope (from S.E.F.). [Reprinted from Figure 1 in R. A. Rudel et al: Environmental exposures and mammary gland development: state of the science, public health implications, and research recommendations. Environ Health Perspect. 2011;119:1053–1061 (801), with permissio
Yuka App Shoppers can simply scan the barcode of a product while in the store, and the app will flag potential health concerns linked to ingredients.
Climate.us Fired government scientists just launched a new site to keep climate data public.The site is called Climate.us & it was created by former staffers behind Climate.gov, the NOAA-run website long used by many for trusted climate information."
Proposition 65 List The list contains a wide range of naturally occurring and synthetic chemicals that are known to cause cancer or birth defects or other reproductive harm. These chemicals include additives or ingredients in pesticides, common household products, food, drugs, dyes, or solvents.
Graphic source: https://www.sciencedaily.com/releases/2018/08/180822112406.htm
Upper panel a: How air pollution shortens human life expectancy around the world. Lower panel b: Gains in life expectancy that could be reached by meeting World Health Organization guidelines for air quality around the world.
Credit: Cockrell School of Engineering, The University of Texas at Austin
Air pollution is responsible for these percentages
Graphic source: http://breathelife2030.org/
Earthquakes have risen alongside wastewater injections in Texas. This chart shows earthquakes around the city of Pecos. Red indicates earthquakes. Green is oil production, and blue is wastewater disposal in millions of barrels. (Yellow shows the rise in natural gas production.) Adapted from “The Proliferation of Induced Seismicity in the Permian Basin, Texas” by Robert J. Skoumal and Daniel T. Trugman.
Seven Steps for Reducing Plastics Consumption (Pri-Med 4/5/2025)
"I just want to say one word to you. Just one word-plastics." Baby Boomers who took career advice from The Graduate made out pretty well. But the pendulum swung too far. A spoonful of microplastics and nanoplastics (MNPs) now live rent-free in the human brain, with even higher levels found in people with dementia. Plastic-free living may be unrealistic—the honey is already out of the plastic bear-but simple mitigation steps based on a recent review of the evidence may help reduce MNP intake.
Seven simple steps for minimizing MNP intake
Switch from bottled to filtered/tap water to cut MNP intake from 90,000 to 4,000 particles/year.
Stop microwaving food in plastic to avoid releasing billions of MNPs into meals (up to 4.22 million microplastic and 11 billion nanoplastic particles/cm2 in only three minutes).
Swap plastic tea bags for loose leaf tea to prevent leaching trillions of particles into mugs.
Use a HEPA air filter to trap nearly 99.97% of airborne MNPs and reduce inhalation exposure.
Store food in glass or stainless steel instead of plastic containers.
Limit canned foods, which are lined with plastic coatings that contain bisphenol A (BPA) and can spike BPA levels by >1,000% in just five days.
Choose whole foods over processed ones, as items like chicken nuggets contain 30 times more microplastics than chicken breasts.
To be clear: Cutting MNP ingestion and consumption as outlined above makes sense, but clinical trials have yet to show if these steps will lead to a measurable drop in MNP buildup in the human body.
Key takeaways
MNP ingestion and inhalation can sabotage cellular function and cripple organ systems through oxidative stress, inflammation, metabolic disruption, and carcinogenesis. Worse, these particles lurk in everything from food to cleaning supplies to beauty products. But let's reclaim the keyboard from Debbie Downer. A reassuring finding from the study is the apparent disconnect between age and microplastic buildup, hinting that the body purges MNPs through sweat, urine, and feces-despite constant environmental assault. And patients may tilt the odds further by adopting the steps above. Number one—ditch the plastic water bottle.
“TILT,” short for Toxicant Induced Loss of Tolerance.
TILT posits that a surprising range of today’s most common chronic conditions are linked to daily exposure to very low doses of synthetic chemicals that have been in mass production since World War II. These include organophosphate pesticides, flame-retardants, formaldehyde, benzene, and tens of thousands of other chemicals.
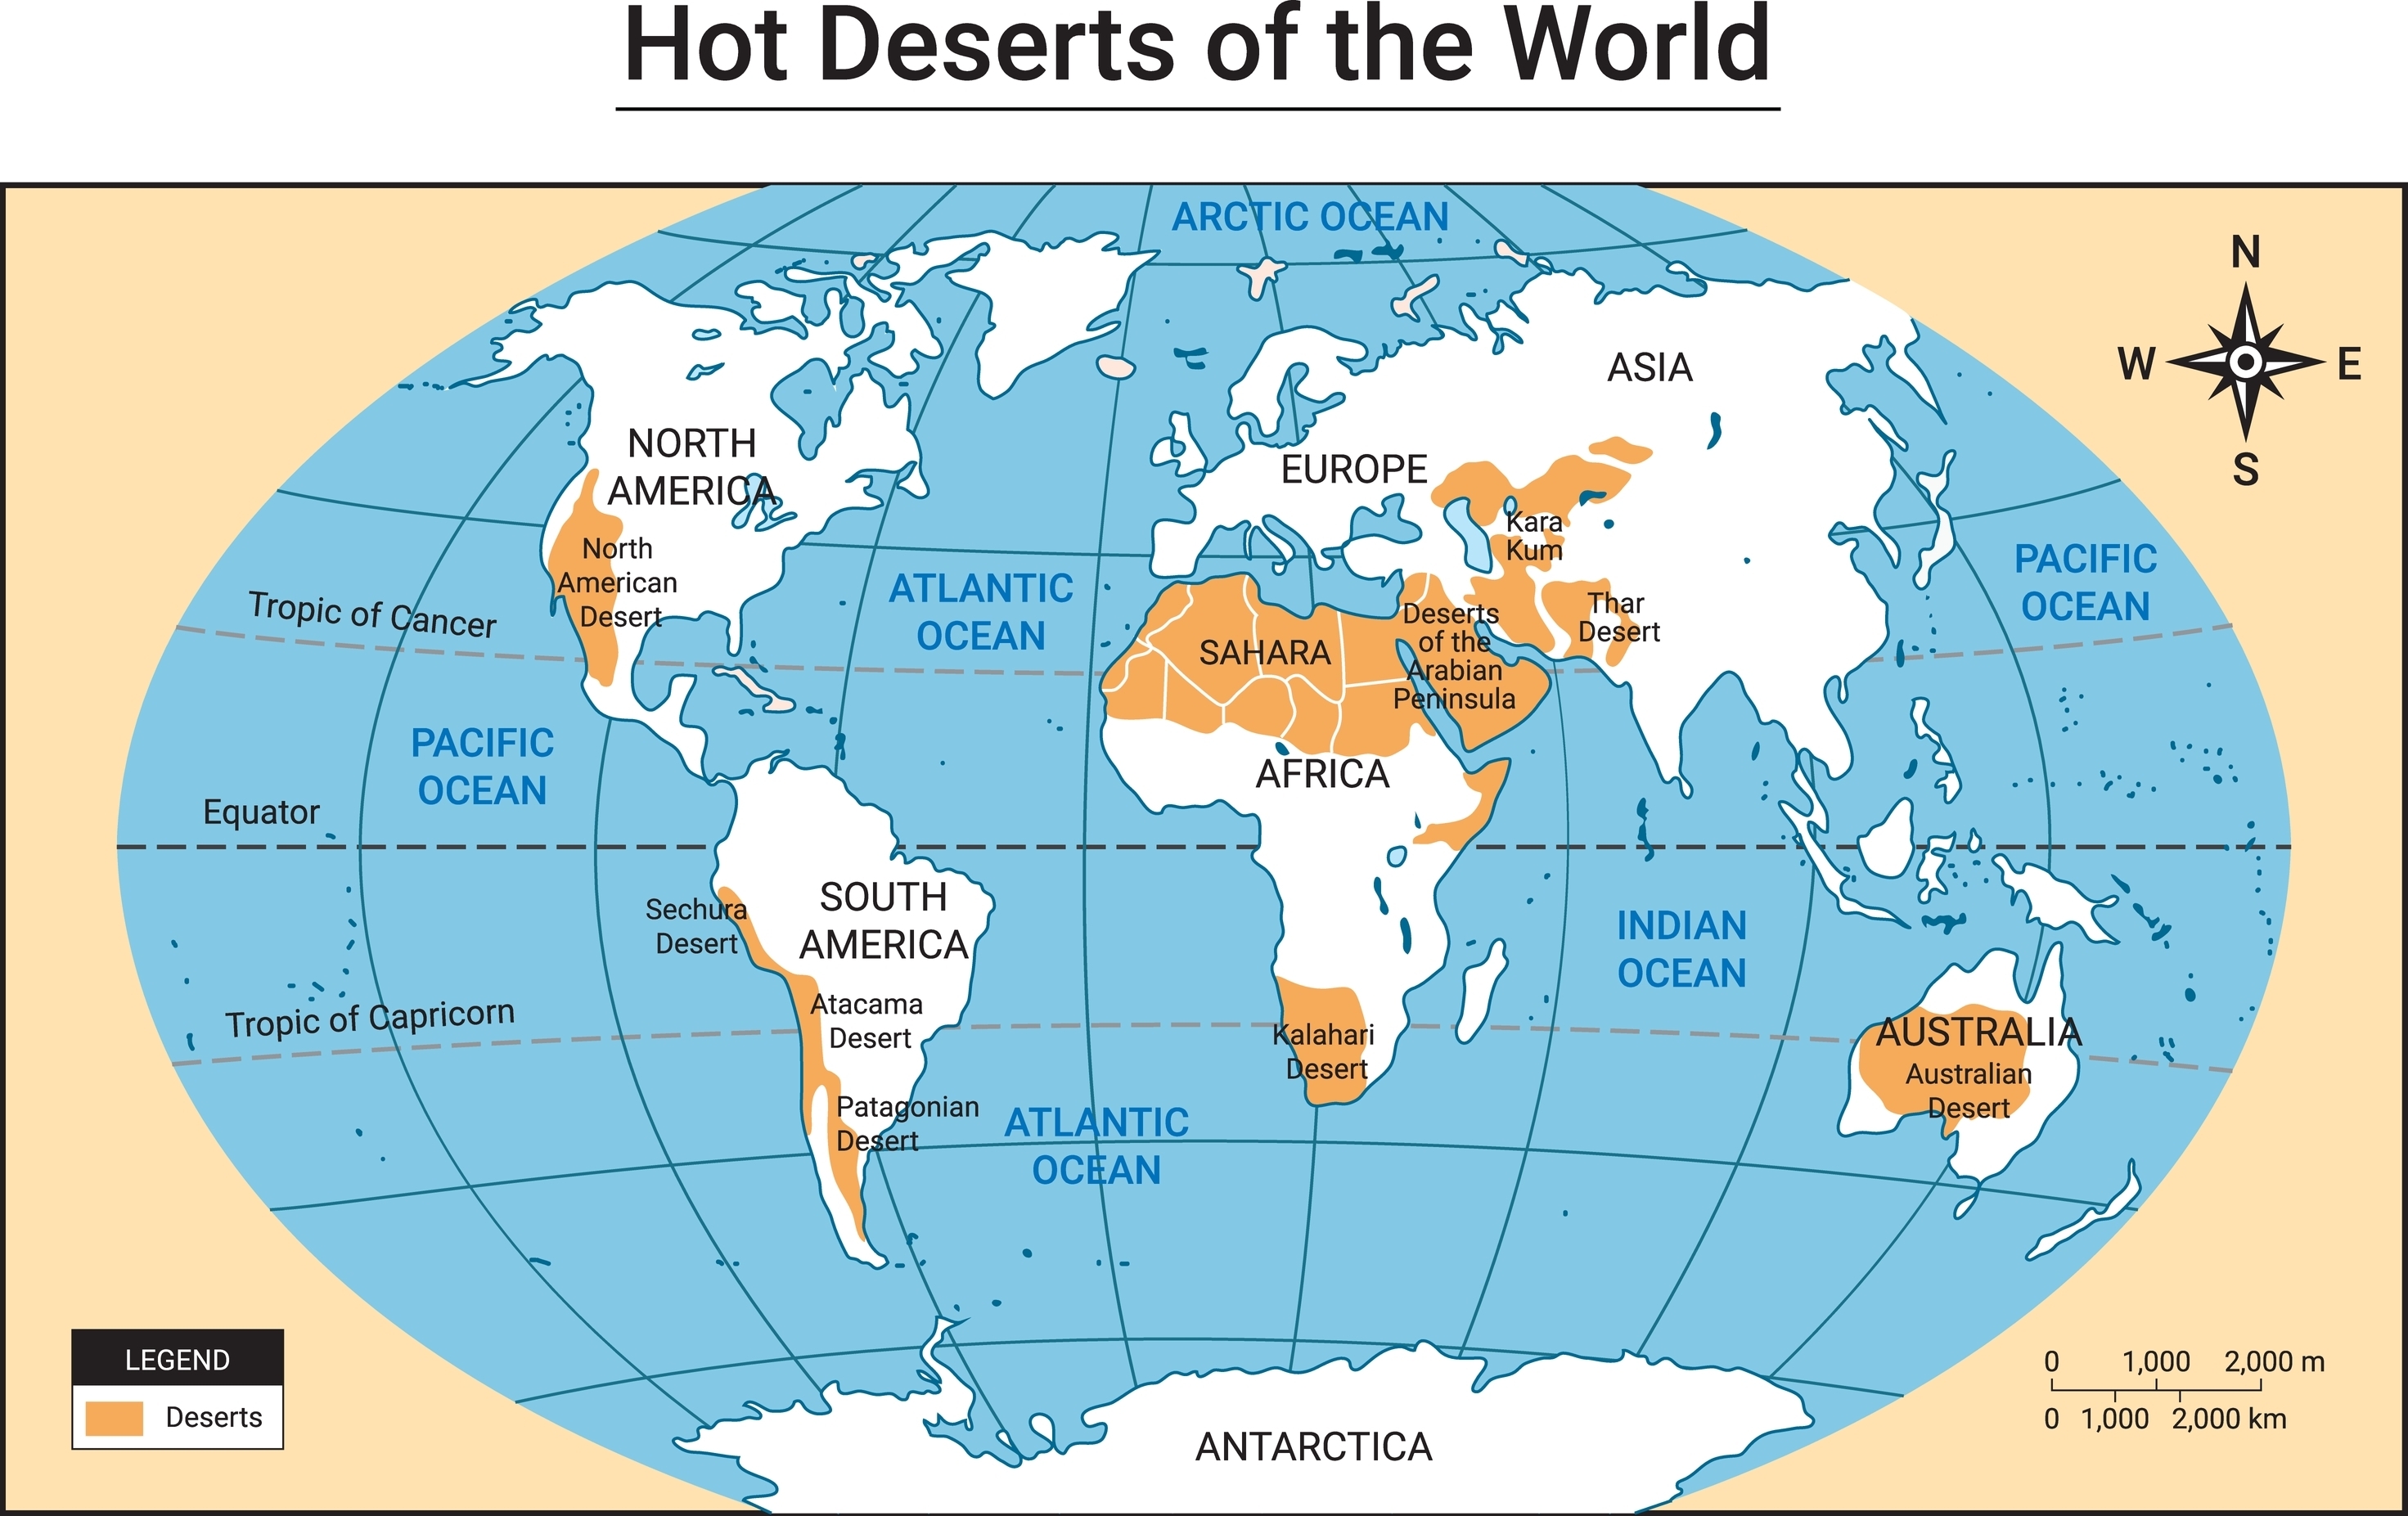
Map description: A map of the world with white continents surrounded by a blue ocean. Parts of the continents are shaded with rust-colored orange, with a legend in the corner showing that same color corresponding to the location of the world's deserts.
Many of the world's hot and dry deserts (notably, not cold deserts, like those in the Arctic and Antarctica), sit between 20 and 40 degrees north or south of the equator. (Sud.ansh via Shutterstock)
Video source: https://twitter.com/NASA/status/1691106509319806977
Gulf stream could collapse as early as 2025. This would have disastrous consequences around world, severely disrupting rains that billions of people depend on for food in India, South America and west Africa
Increase storms and drop temperatures in Europe
Video source: https://twitter.com/ECOWARRIORSS/status/1683949982569705472
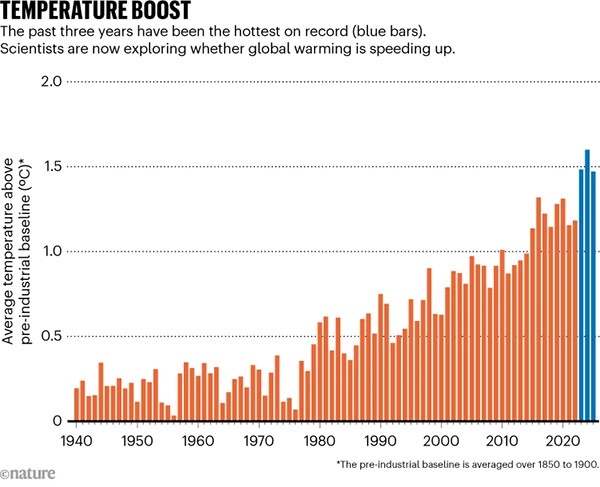
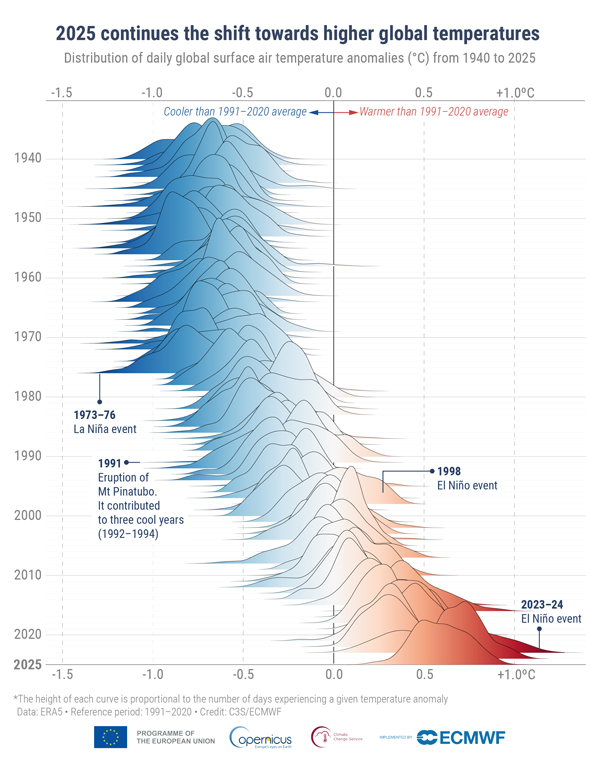
Global daily surface air temperature (°C) from January 1940 to July 2023, plotted as time series for each year. 2023 and 2016 are shown with thick lines shaded in bright red and dark red, respectively.World Meteorological Organization


 width="600 Alt="Floodplains map">


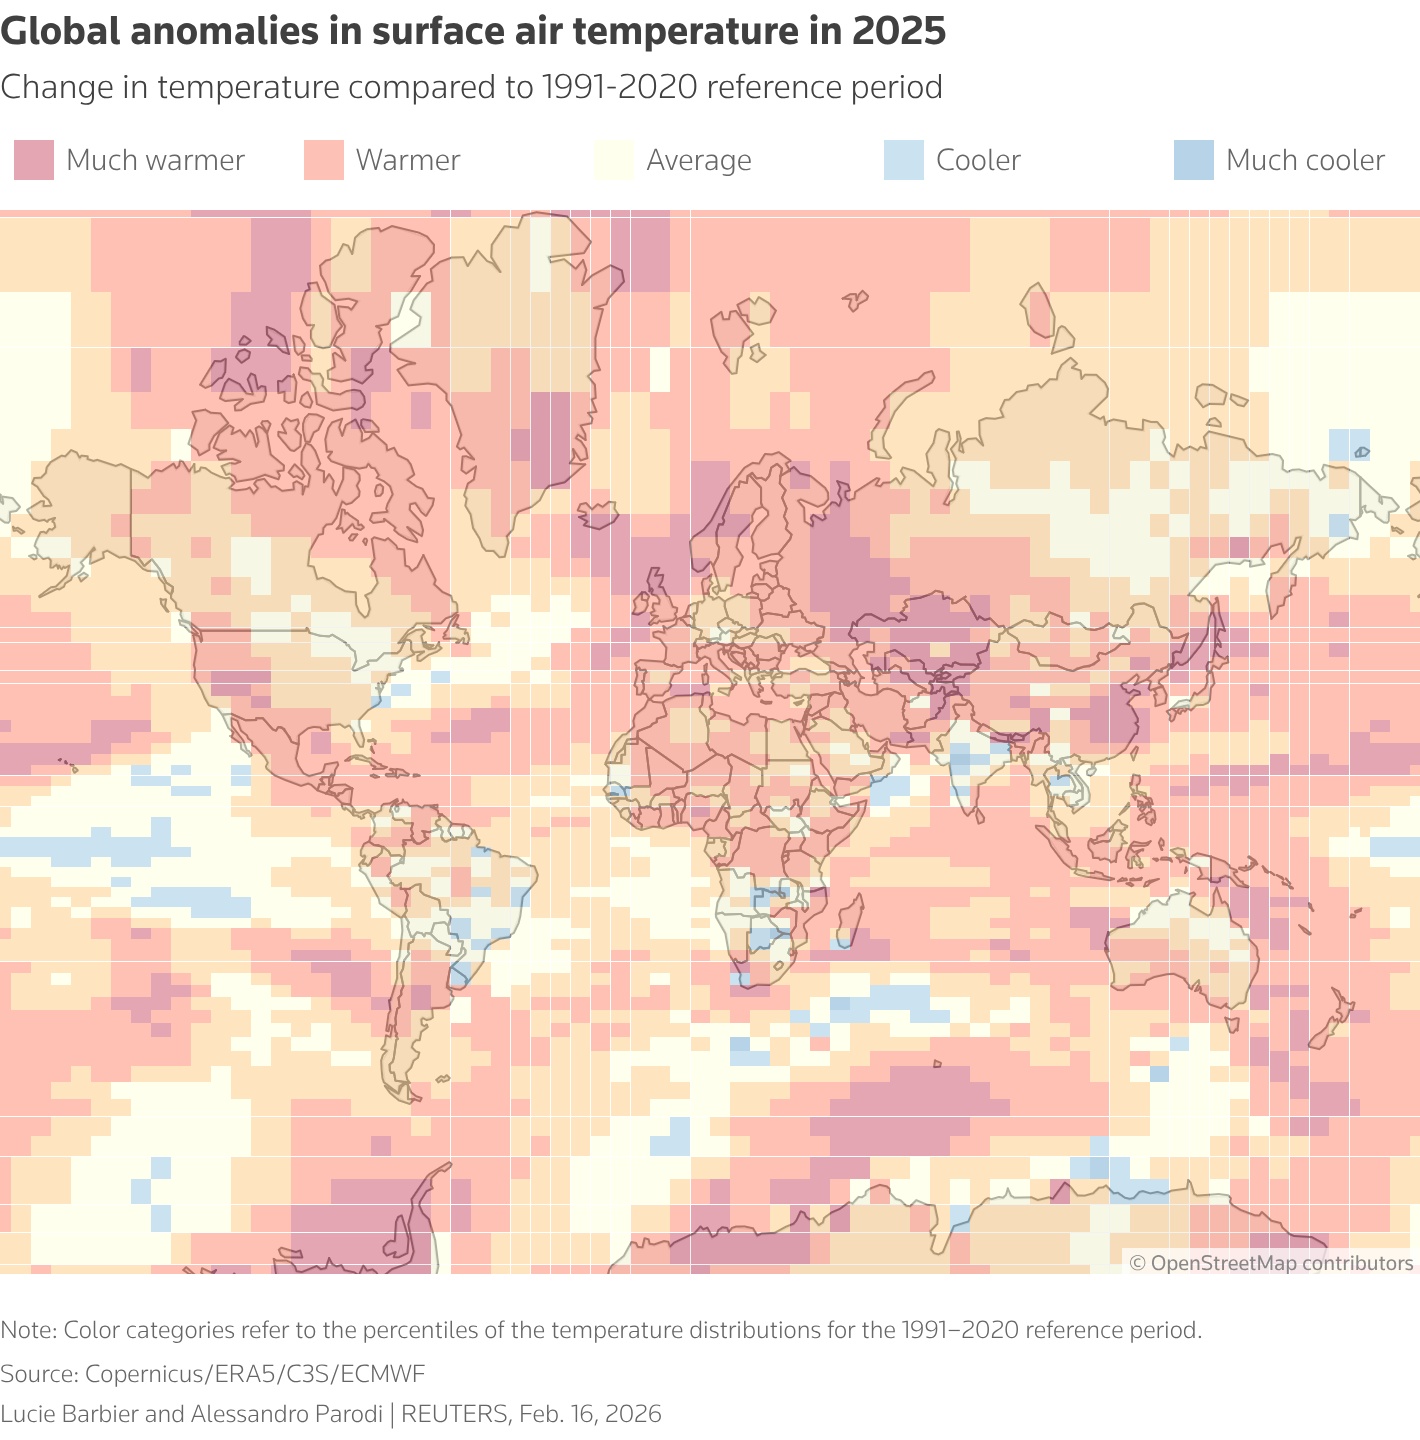
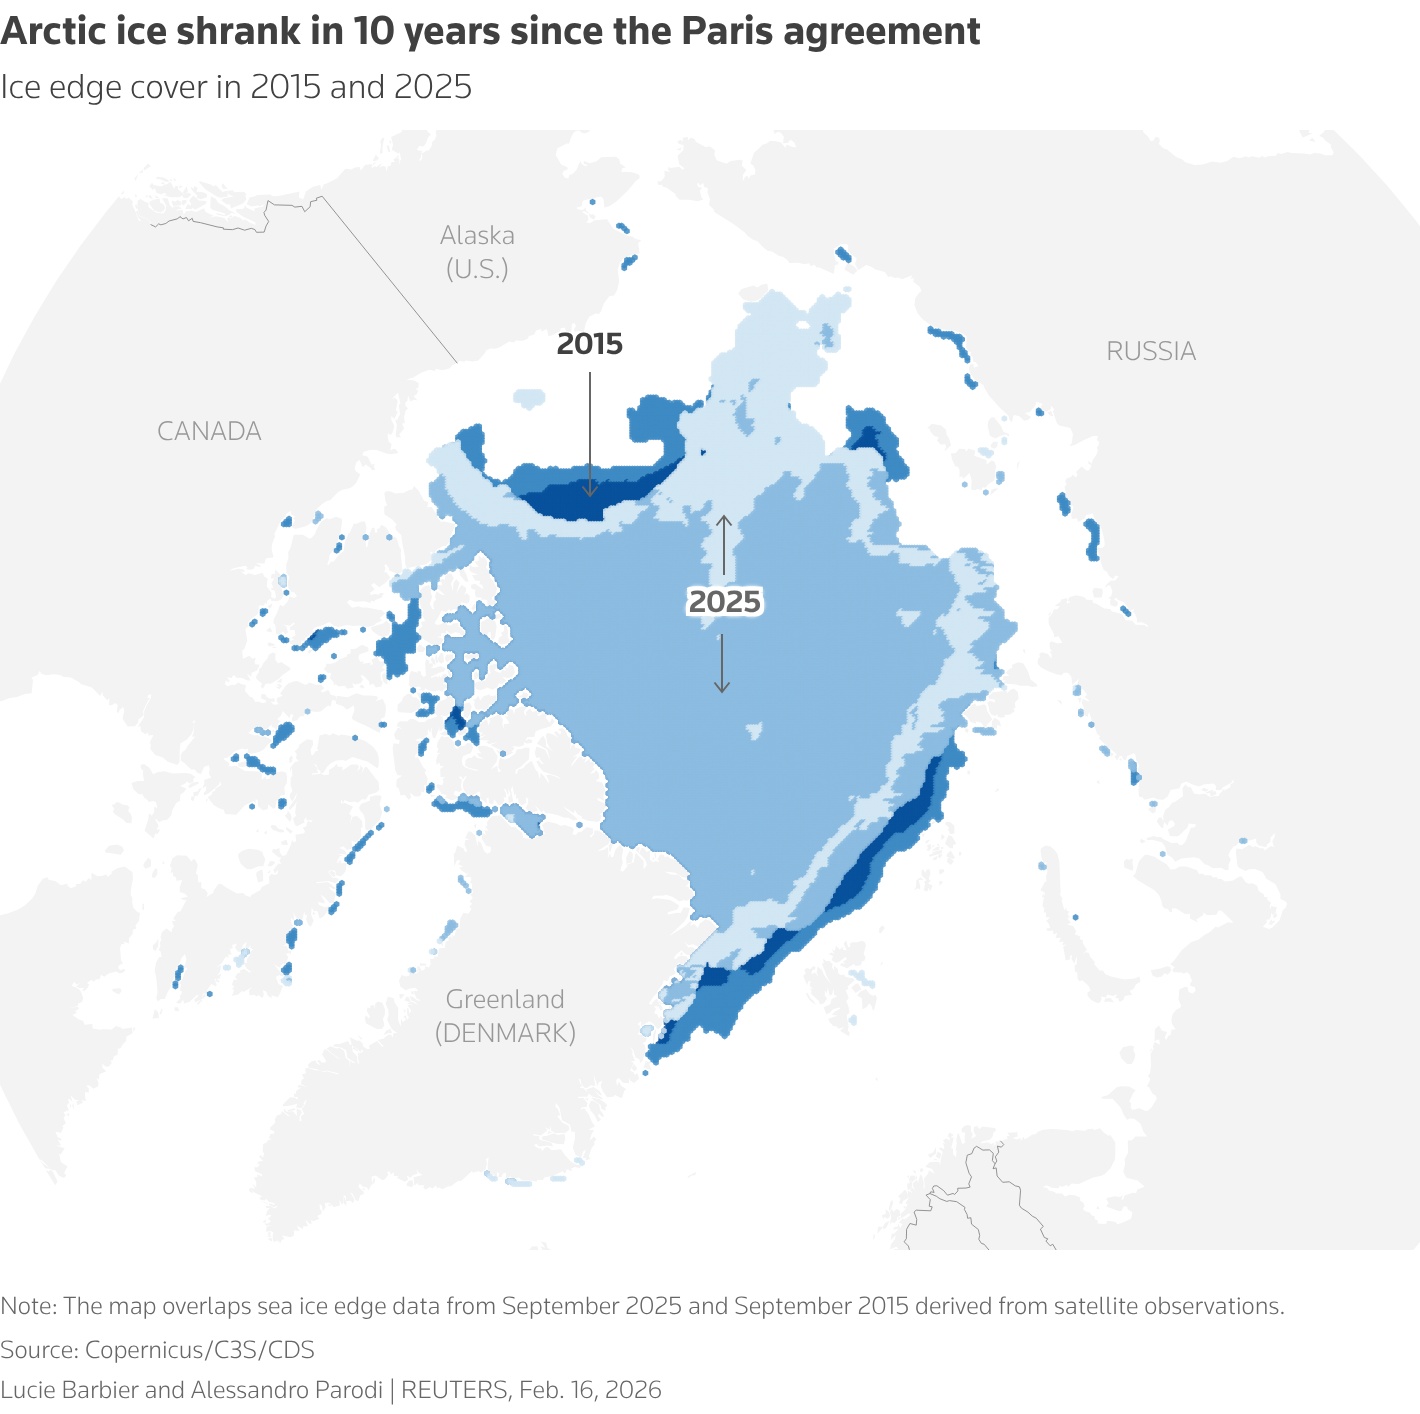
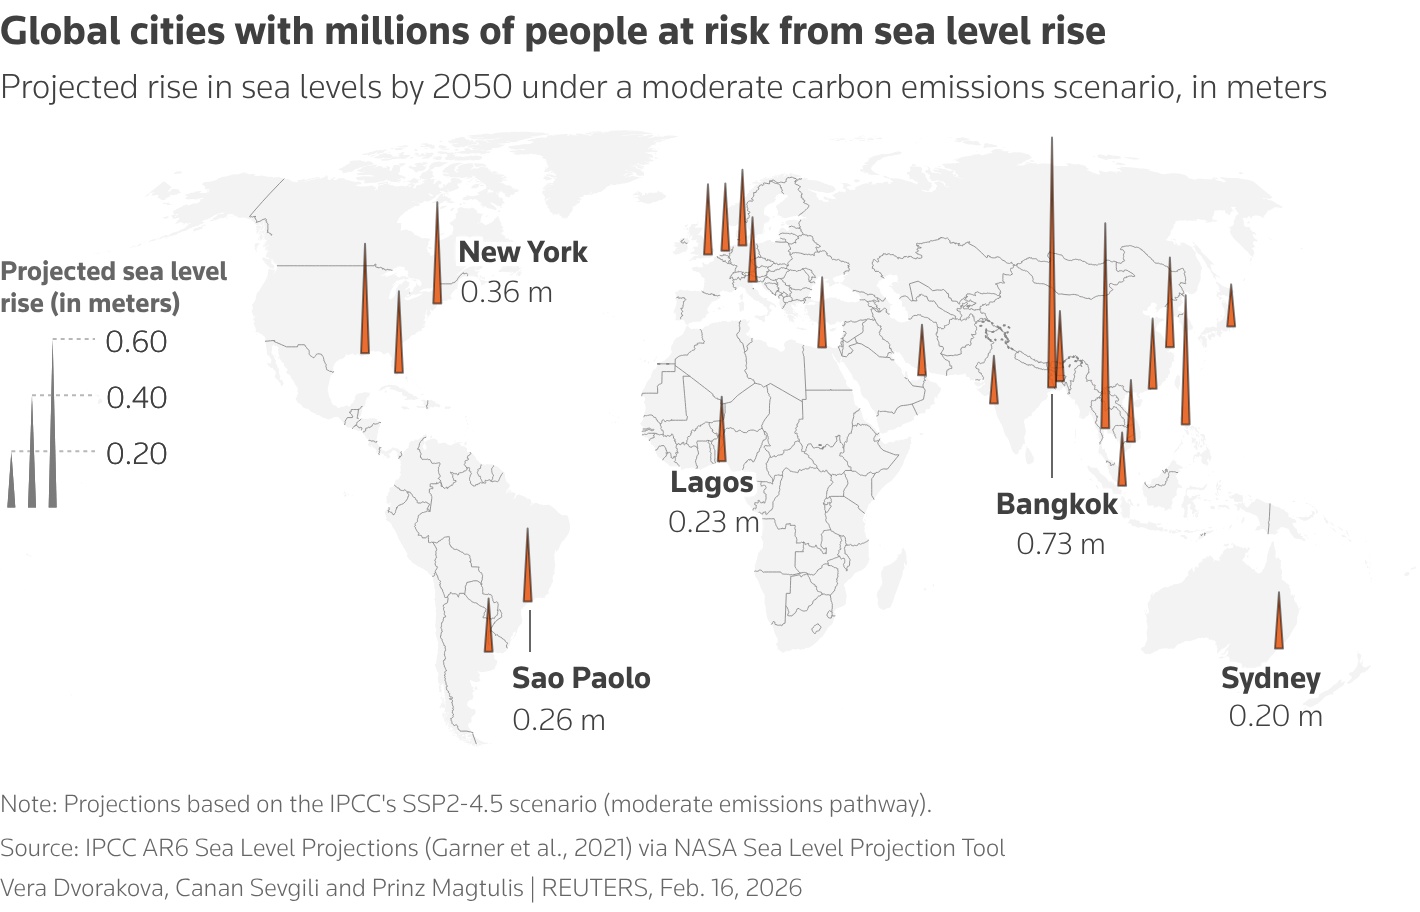
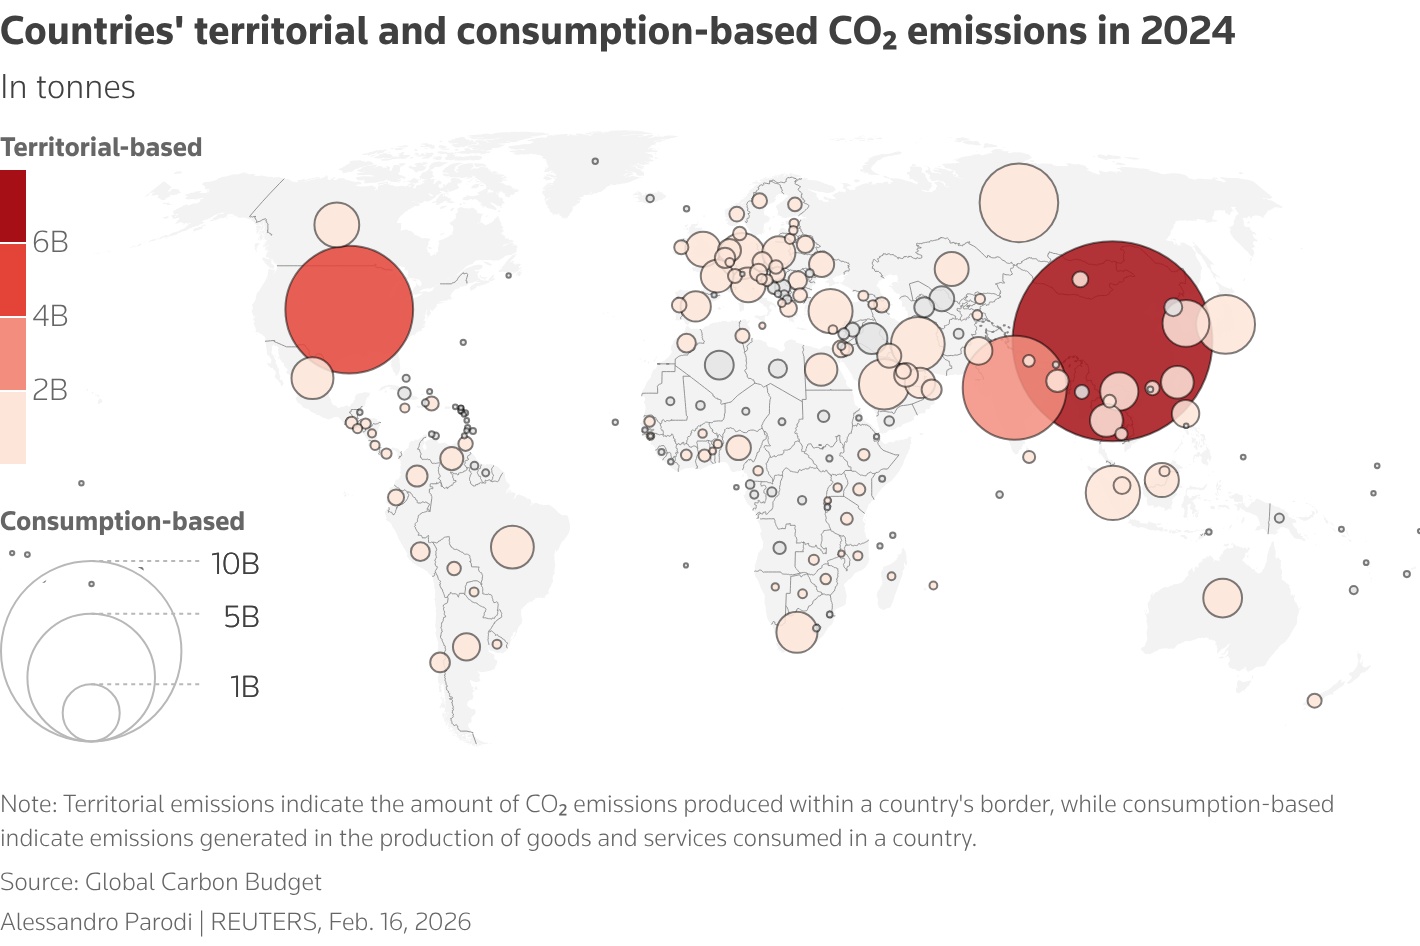 Graphic source: https://www.reuters.com/sustainability/cop/climate-crossroads-decade-after-paris-agreement-2026-02-16/


 impact">


