All changes made to U.S. federal government webpages and sources, since January 20, 2025, have been moved to:

MetaSearch Sites
Maps and Charts

SOURCES OF STATE & LOCAL AREA DATA
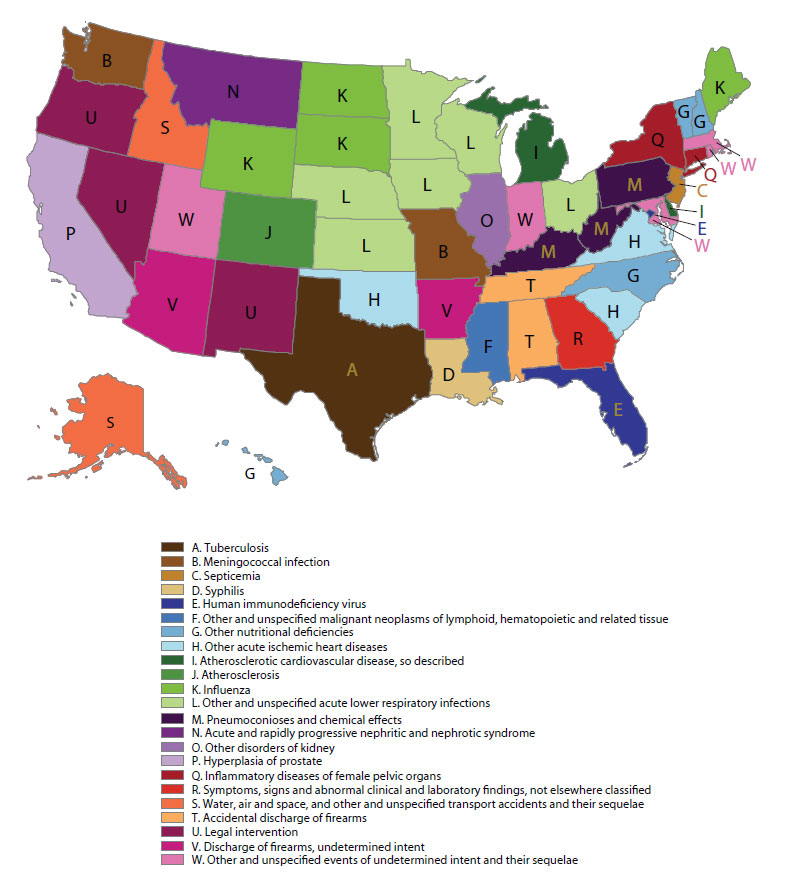
Graphic source:http://www.livescience.com/50837-most-distinctive-causes-death-united-states.html
Crime Statistics
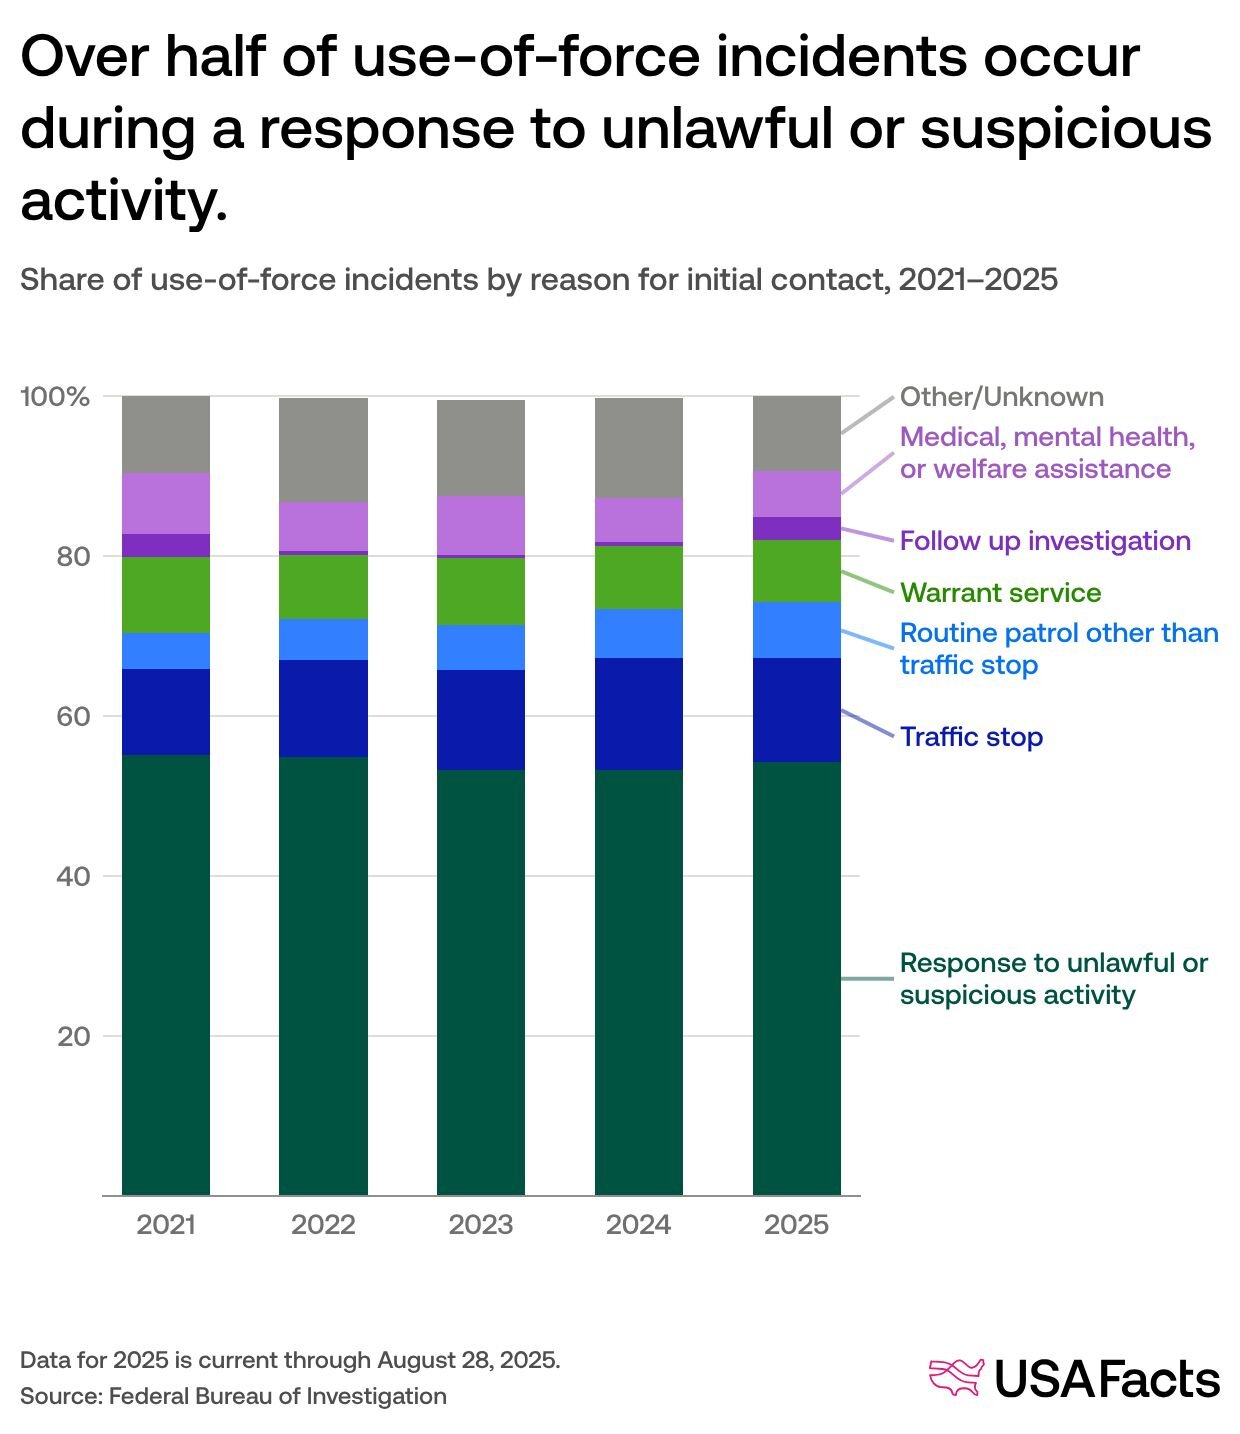
Graphic source:https://usafacts.org/articles/what-the-data-says-about-law-enforcement-use-of-force
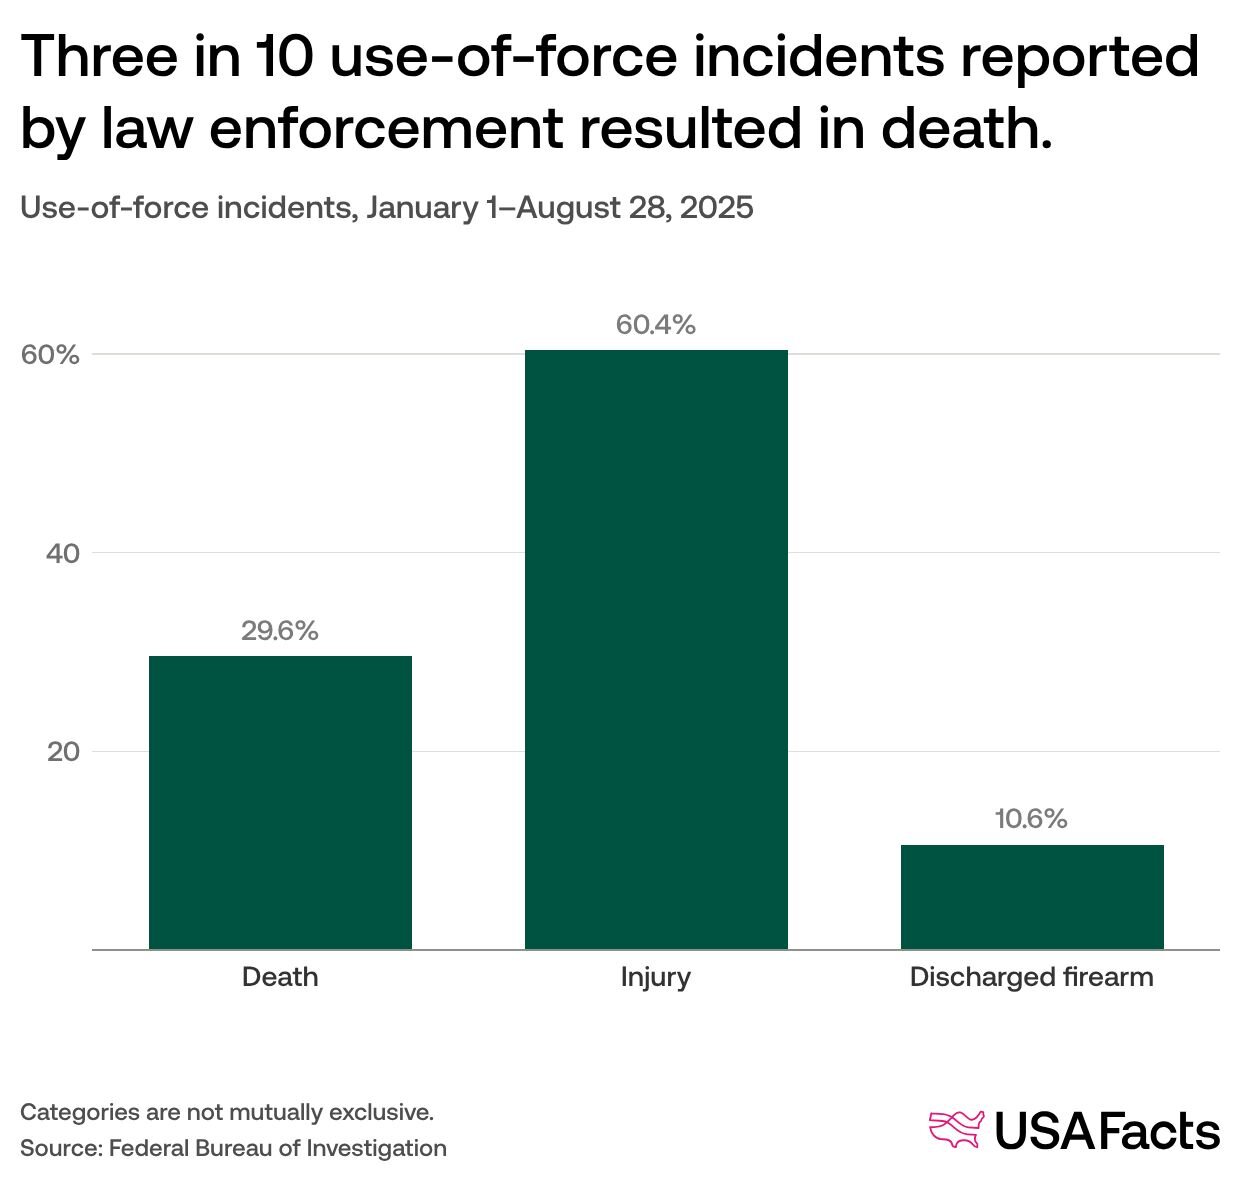
Graphic source:https://usafacts.org/articles/what-the-data-says-about-law-enforcement-use-of-force
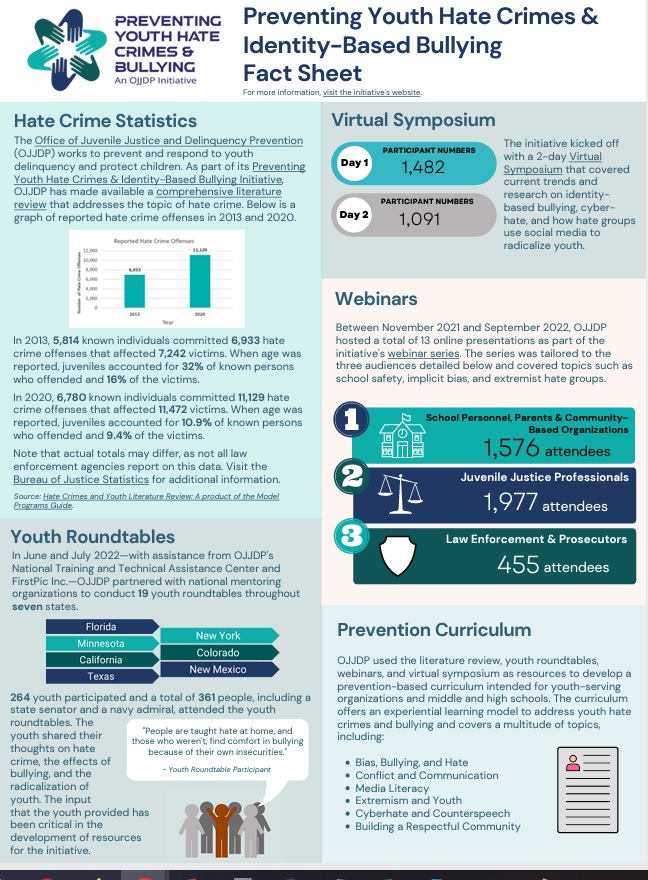
Graphic source: https://ojjdp.ojp.gov/library/publications/preventing-youth-hate-crimes-identity-based-bullying-fact-sheet
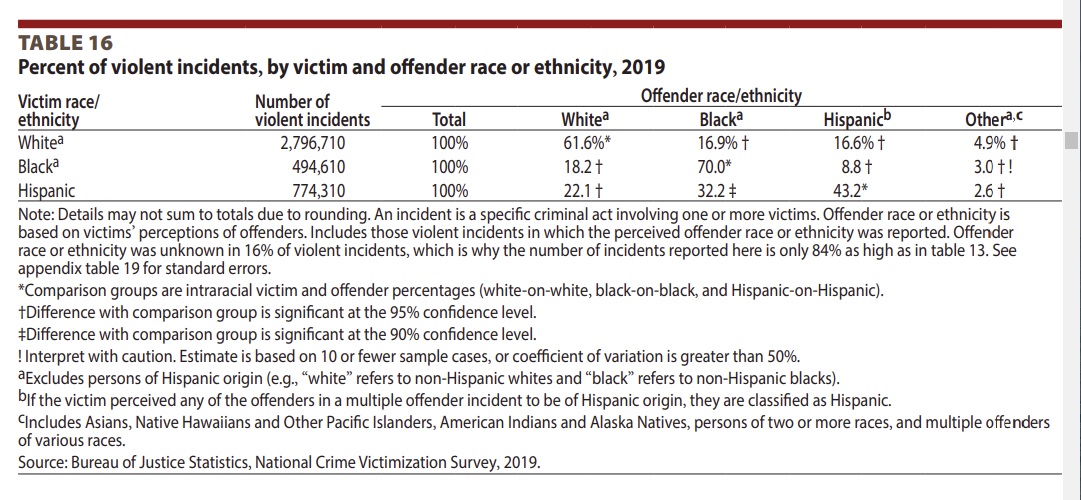
Graphic source: https://www.bjs.gov/content/pub/pdf/cv19.pdf
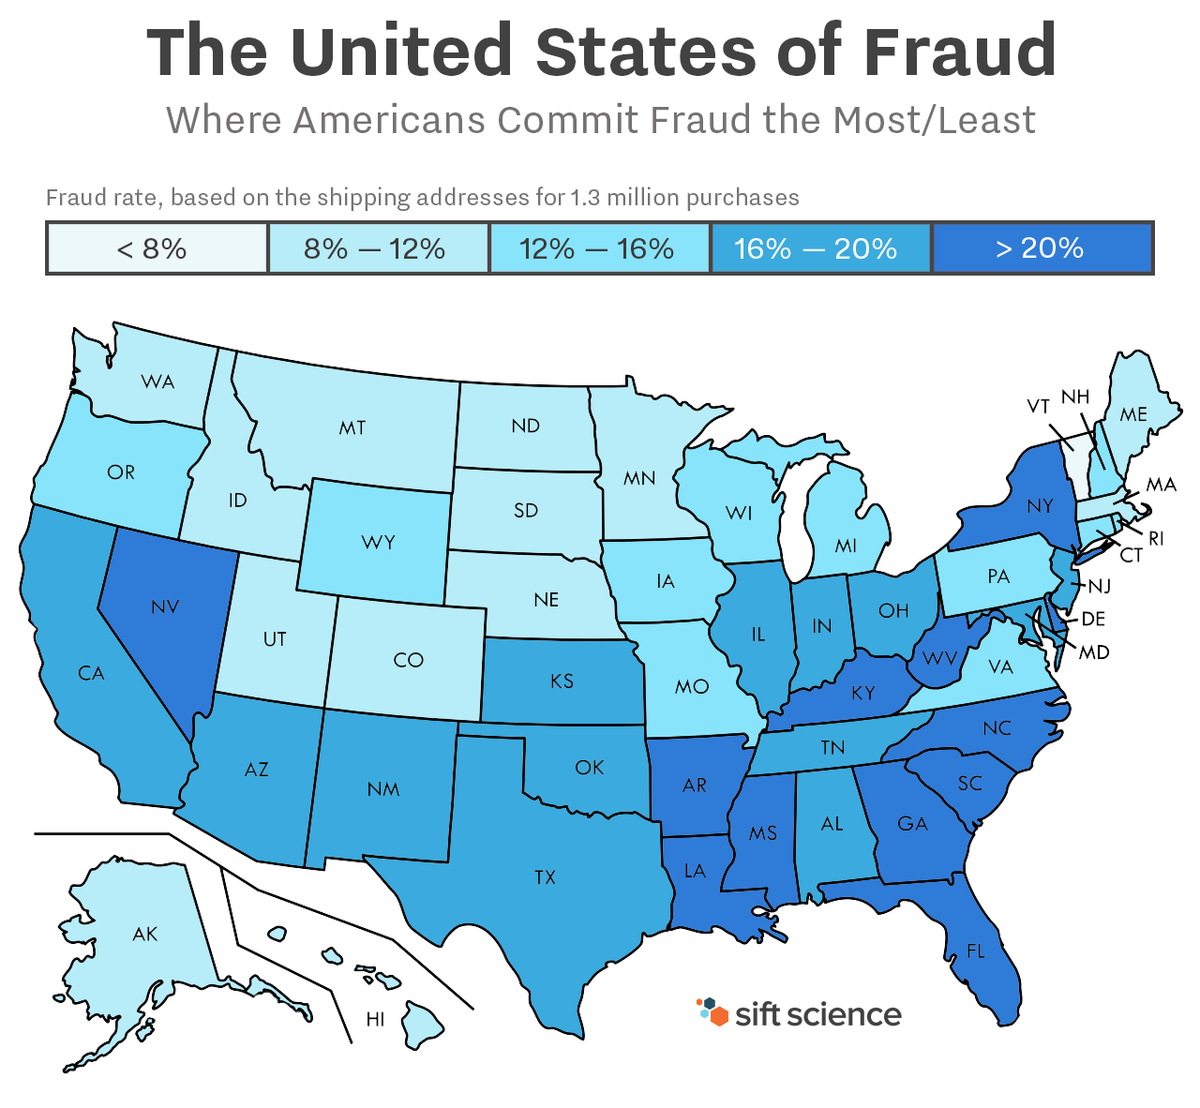
Graphic source: https://priceonomics.com/where-in-america-are-the-most-online-fraudsters/
- Federal Criminal Case Processing Statistics Data Tool
- NCVS Dashboard (N-DASH) National Crime Victimization Survey (NCVS) data - The NCVS is the nation’s primary source of information on criminal victimization. Bureau of Justice Statistics.
- 2016 Crime Statistics FBI.gov
- Bureau of Justice Statistics
- Bureau of Justice - Key Statistics
-
 Bureau of Justice Indicators of School Crime and Safety: 2016
- 5 facts about crime in the U.S. 1/2019
- Capital Punishment, 2018 – Statistical Tables 9/2020
- Capital Punishment, 2016 4/2018
- Correctional Populations in the United States, 2017-2018 8/2020 Dept. of Justice
- Criminal Victimization, 2022 Bjs.ojp.gov
- Criminal Victimization, 2019
- Criminal Victimization, 2018
- Federal Justice Statistics, 2015-2016 1/2019
- Federal Justice Statistics, 2013-2014 3/2017 BJS.gov
- Federal Justice Statistics, 2014 - Statistical Tables 3/2017 BJS.gov
- Federal Justice Statistics, 2013 - Statistical Tables 3/2017 BJS.gov
- Federal Prosecution of Human-Trafficking Cases, 2015 6/2018
- Hate Crime
Victimization, 2004-2015 BJS.gov 6/2017
- Hate Crime
Victimization, 2004-2015 Summary Report BJS.gov 6/2017
- Indicators of School Crime and Safety: 2018
- Indicators of
School Crime and Safety: 2012
- Law Enforcement Officers Killed and Assaulted, 2019 – Tables 6/2020
- Preventing Youth Hate Crimes & Identity-Based Bullying Fact Sheet 11/2022
- Prisoners in 2016 1/2018
- Prisoners in 2016 Summary 1/2018
Race and Ethnicity of Violent Crime Offenders and Arrestees, 2018 1/2021
- Race and Hispanic Origin of Victims and Offenders, 2012-15
- Race and Homicide in America, by the Numbers
New federal statistics have some interesting things to say about interracial killings and ‘black-on-black’ homicides. 9/2016
- Race, Ethnicity, and Sex of Victim by Race, Ethnicity, and Sex of Offender, 2014 FBI.gov
- The Top 10 Most Startling Facts About People of Color and Criminal Justice in the United States Americanprogress.org 2012
- Crime Against Persons with Disabilities, 2009-2015 - Statistical Tables 7/2017
- Crime Statistics - Definitions California
- Crime Victims' Institute SHSU Criminal Justice Center
- Criminal Victimization, 2017 12/2018
- Federal Bureau of Prisons - Quick Stats
-
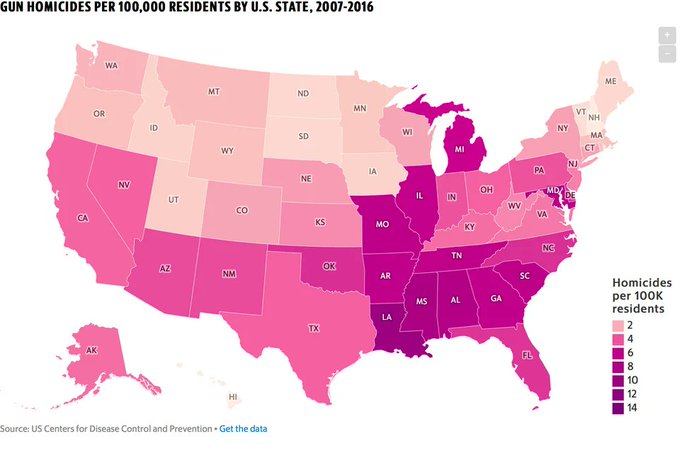
Gun violence in America, in 17 maps and charts
- Hate Crime Statistics 2010 FBI.gov
- Homicide and Suicide Rates --- National Violent Death Reporting System, Six States, 2003 MMWR 4/25/2005
- Indicators of School Crime and Safety: 2015 BJS.gov
- Mass shootings since Sandy Hook, in one map Vox.com
- Multistate Criminal History Patterns Of Prisoners Released In 30 States BJS.gov 2015 summary
- Multistate Criminal History Patterns of Prisoners Released in 30 States Bjs.gov 2015 PDF
- National Violent Death Reporting System CDC.gov
- NCVS Victimization Analysis Tool (NVAT) BJS.gov 2015
- One map that puts America's gun violence epidemic in perspective Vox.com
- Prisoners 2014 Bureau of Justice.gov 2015
- Prisoners in 2014 PDF - full report Bureau of Justice.gov 2015
- Study finds racial, ethnic divide in attention to crime news Pewresearch.org
- Trafficking in Persons Report 2014 State.gov
- Uniform Crime Reports
- USA Homicide Worldlifeexpectancy.com
- Victims of Identity Theft, 2016 1/2019
- US Violent Crime Statistics Worldlifeexpectancy.com
- What FBI data says about law enforcement use-of-force. FBI data offers some insight into when use-of-force incidents happen and what happens when they do. 1/2026
- What the data says (and doesn’t say) about crime in the United States 11/2020
- Where in America Are the Most Online Fraudsters?
Economic Statistics
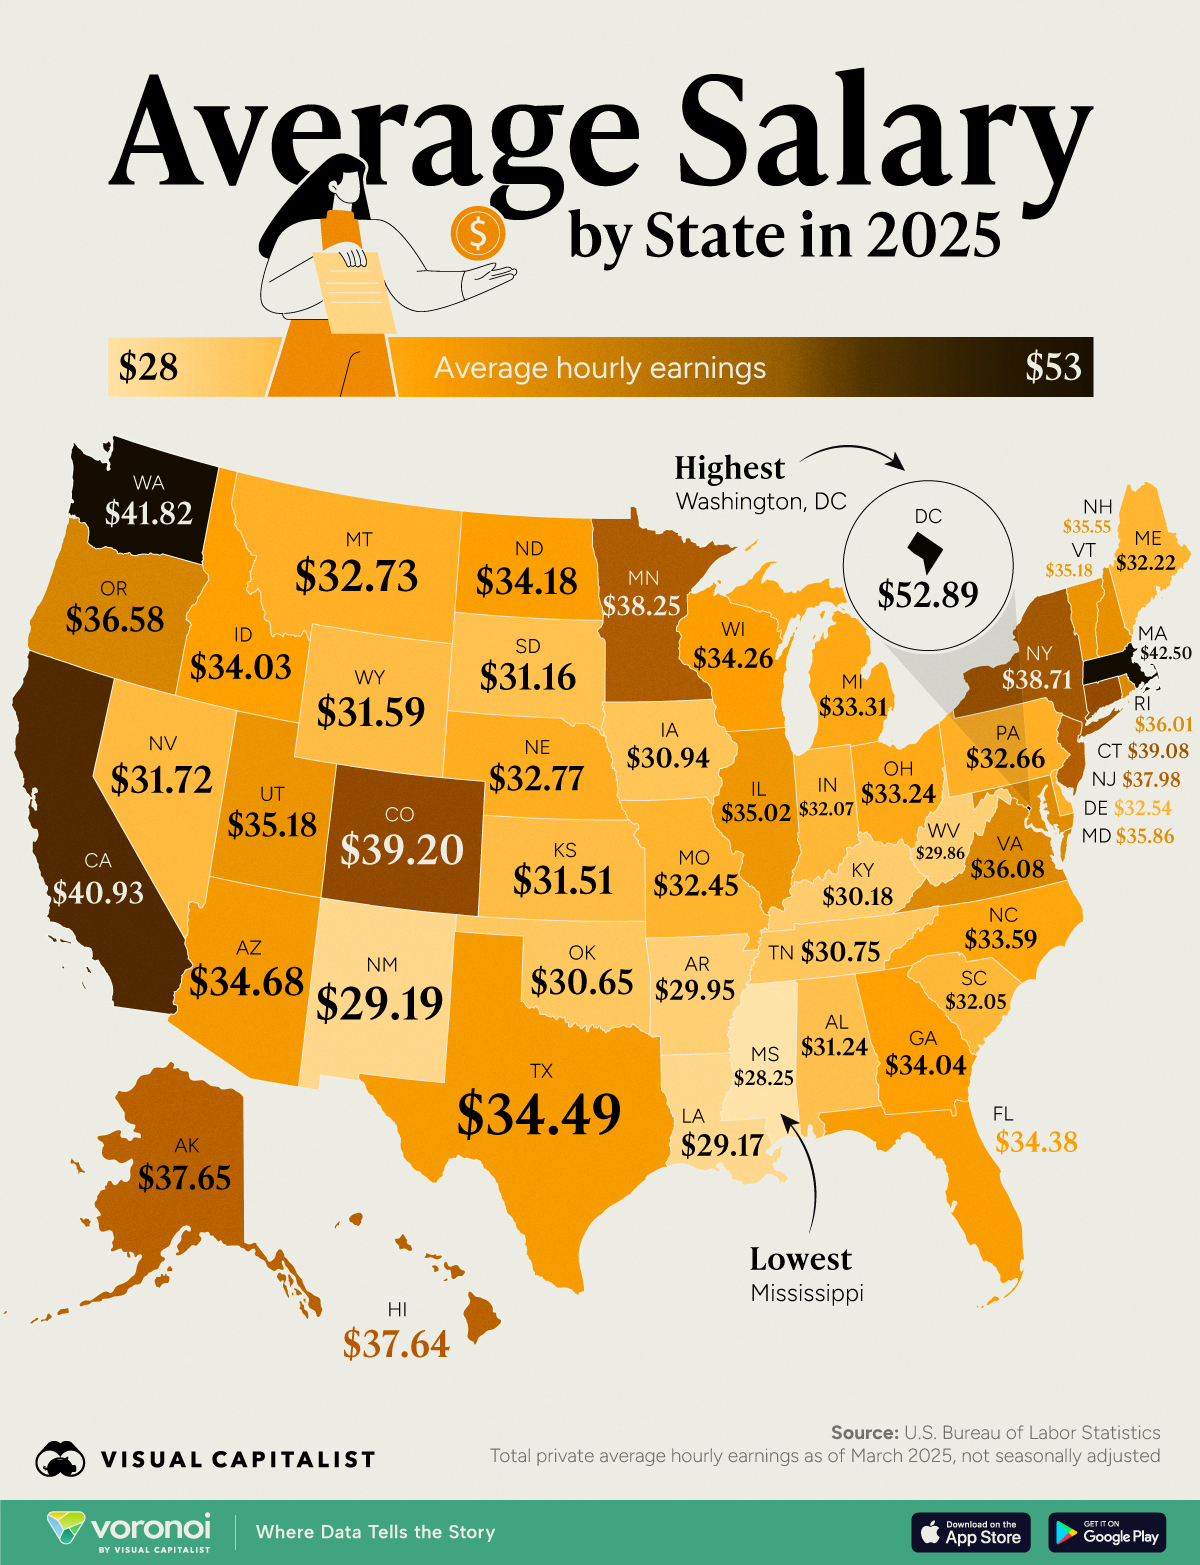
Graphic source: https://www.visualcapitalist.com/mapped-average-salary-by-state-in-2025/
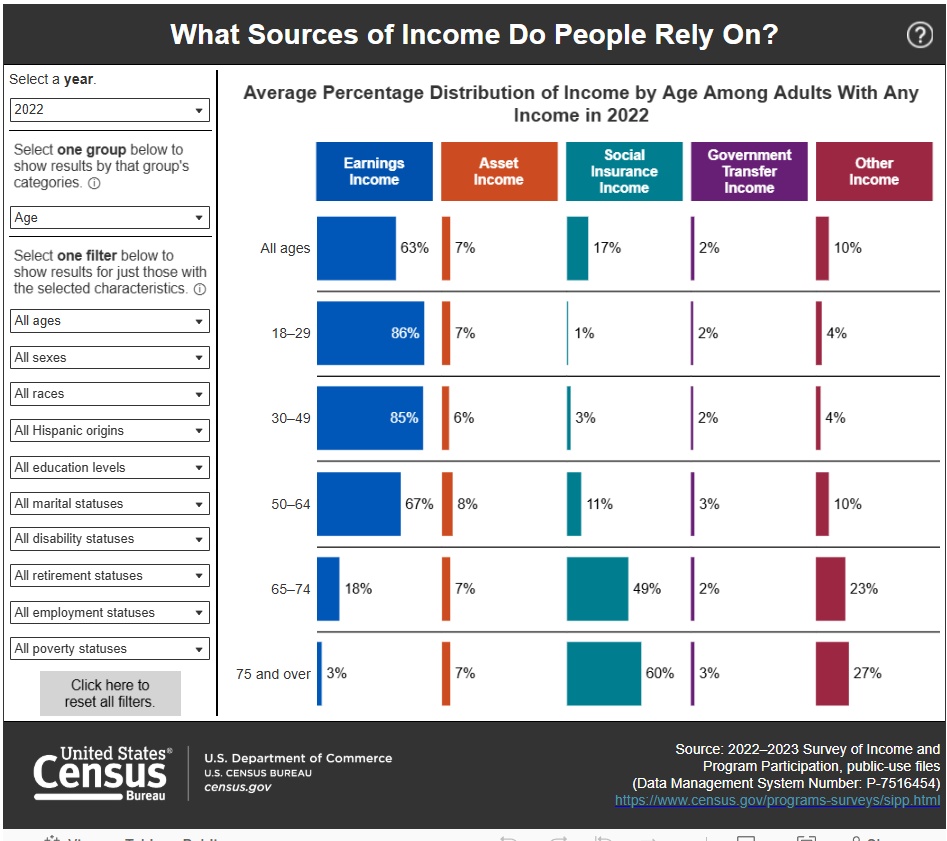
Graphic source: https://www.census.gov/library/stories/2025/04/income-sources.html
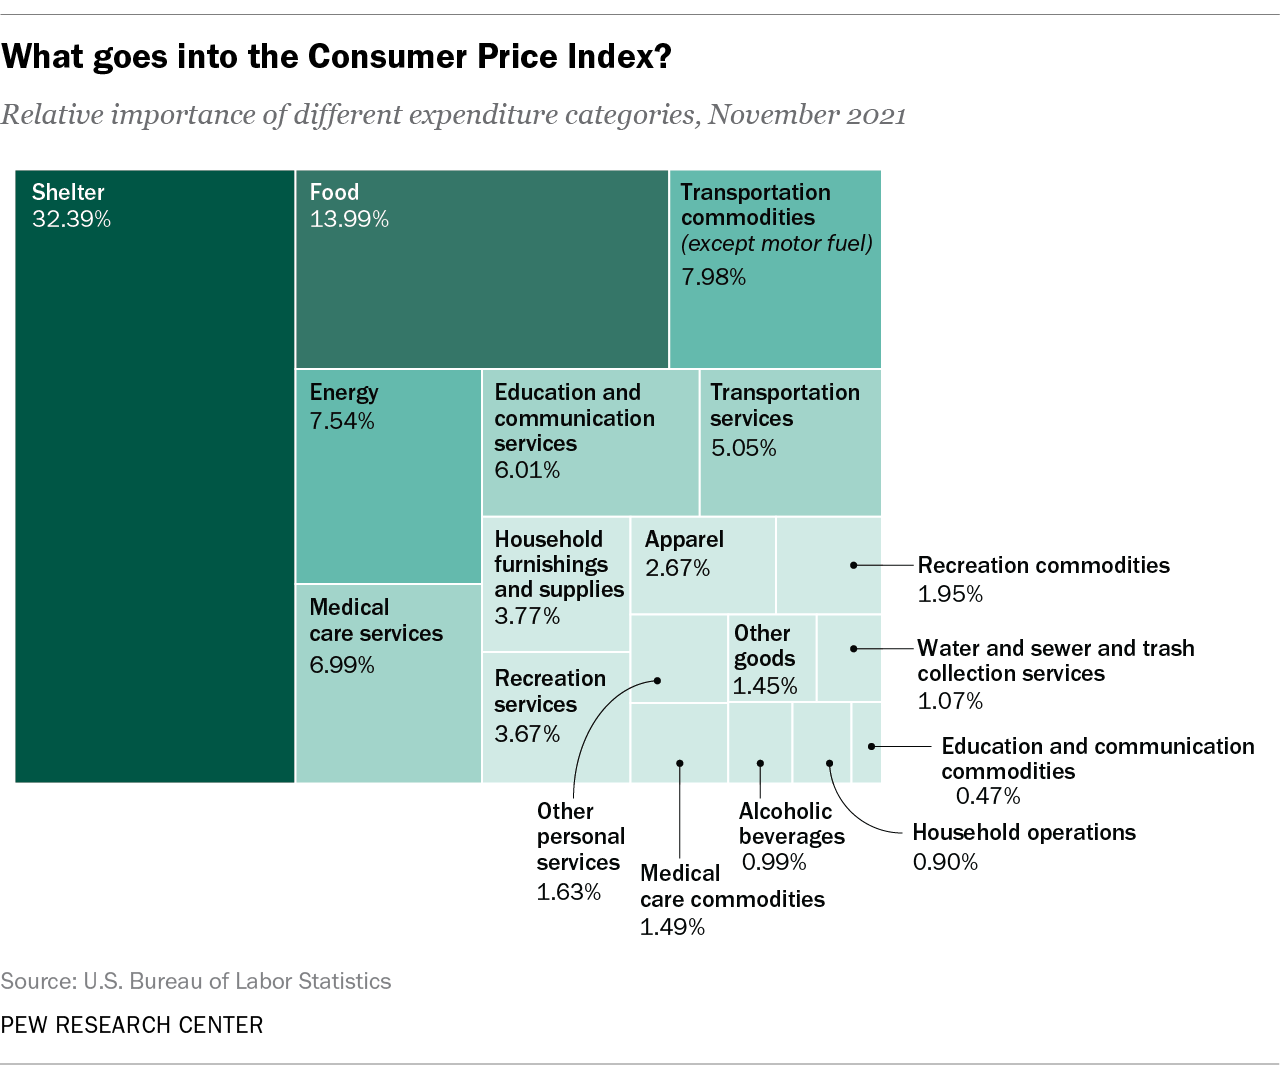
Graphic source: https://www.pewresearch.org/fact-tank/2022/01/24/as-inflation-soars-a-look-at-whats-inside-the-consumer-price-index/ft_22-01-14_insidecpi_1/
Graphic source:
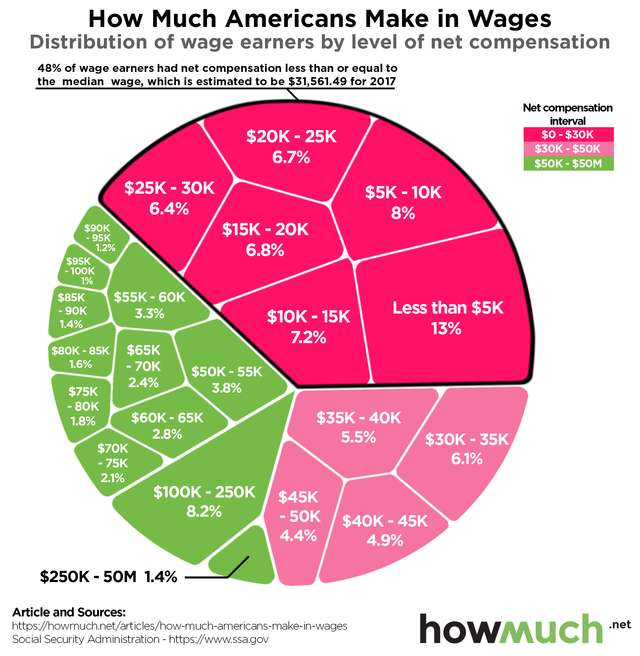
https://www.thrillist.com/news/nation/howmuch-chart-income-inequality-in-us

Graphic source: http://www.marketingcharts.com/traditional/these-financial-stats-show-why-brands-shouldnt-focus-too-much-on-millennials-75298/attachment/epsilon-financial-stats-us-adults-by-generation-mar2017/
Graphic source: http://www.vox.com/xpress/2014/11/10/7186151/wealth-inequality-saez-zucman-chart-gif
- Economic Indicators U.S. Census
- Census Bureau Economic Briefing Room Economic Indicators
- About Half of Americans Identify as Middle Class 7/2022
- Quarterly Report on Household Debt and Credit 11/2020
- A Visual Summary of An Update to the Budget and Economic Outlook: 2019 to 2029 CBO.gov August 2019
- Updated Budget Projections: 2019 to 2029 CBO.gov May 2019
- 8 facts about American workers Pewresearch.org
- 10 Things to Know About CBO 6/2018
- American Time Use Survey
- Bureau of Labor Job Statistics
- Income and Poverty in the United States: 2018 9/2019
- Incomes of whites, blacks, Hispanics and Asians in the U.S., 1970 and 2016 7/2018
- Middle-Class Identification Steady in U.S. 5/2022
- National Economic Indicators Richmond Bank Most recent issue
- ADP National Employment Trends
- Annual Capital Expenditures Survey US Census
- Bureau of Labor Statistics
- Bureau of Labor Statistics - Archived News Releases
- CEPR Uniform Data Extracts Center for Economic and Policy Research (CEPR)
- Current Population Statistics Nber.org, monthly survey of unemployment and labor force participation. Thanks Will Bailey
- Employed persons by detailed occupation, sex, race, and Hispanic or Latino ethnicity BLS.gov 2/2015
- Employment Cost Index
- Employment Decisions of U.S. and Foreign Doctoral Graduates: A Comparative Study 12/2014 NSF.gov
- Gallup Economy
- How Nonemployed Americans Spend Their Weekdays: Men vs. Women NY Times 2015
- How the Recession Reshaped the Economy, in 255 Charts NY Times.com
- Income, Poverty, and Health Insurance Coverage in the United States: 2011 US Census 9/2012
- Income, Poverty, and Health Insurance Coverage in the United States: 2009 US Census 9/2010
- ISM - Manufacturing ISM Report On Business
- ISM - Non-Manufacturing ISM Report On Business
- LABOR MARKET ACTIVITY, EDUCATION, AND PARTNER STATUS AMONG AMERICA'S YOUNG ADULTS AT 29: RESULTS FROM A LONGITUDINAL SURVEY 4/2016
- Making more than minimum wage, but less than $10.10 an hour PEW 11/2014
- Open the Books - Government Spending
- Oversight of the Congressional Budget Office 7/2018
- Socioeconomic Disparities in Health in the United States: What the Patterns Tell Us NIH.gov
- The American Dream, Quantified at Last 12/2016
-
- The dangerous separation of the American upper middle class Techrepublic.com 9/2015
- The Distribution of Household Income, 2015 November 2018
- This Chart Shows How Much Money Everyone in America Actually Makes 11/2018
- What Sources of Income Do People Rely On? New Interactive Data Tool Shows Sources of Personal Income for Hundreds of Economic and Demographic Combinations
- Which Labor Market Data Should You Believe? 6/2016
Economic Statistics - Income & Retirement
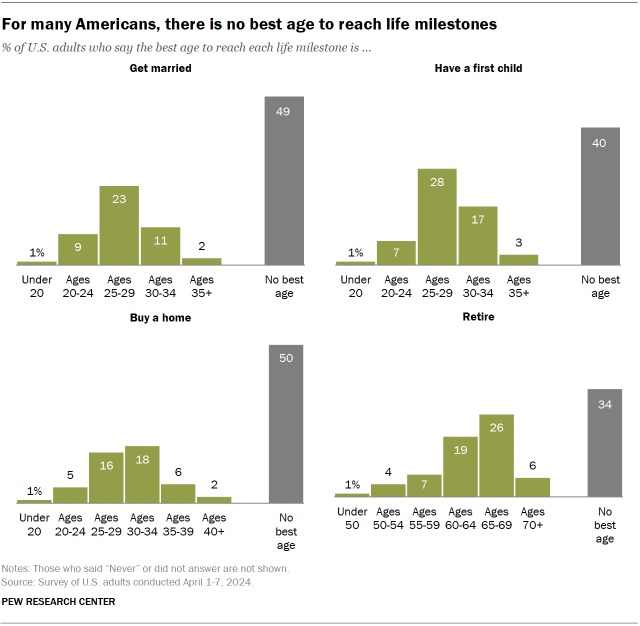
Graphic source: https://www.pewresearch.org/short-reads/2025/03/19/best-age-to-get-married-have-a-child-buy-a-home-and-retire-heres-what-americans-say/
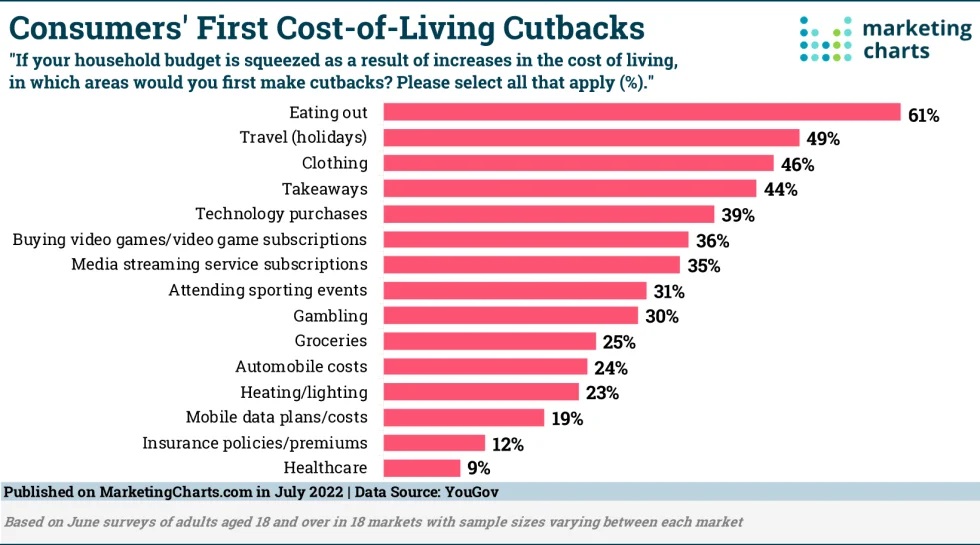
Graphic source: https://www.marketingcharts.com/customer-centric/spending-trends-226487

Graphic source: https://www.marketingcharts.com/charts/us-median-household-income-in-2018/attachment/censusbureau-us-median-household-income-in-2018-oct2019

Graphic source:https://www.thrillist.com/news/nation/the-minimum-hourly-wage-you-need-to-pay-rent-in-all-fifty-states

Graphic source: http://www.marketingcharts.com/traditional/here-are-americans-top-financial-concerns-77468/attachment/gallup-americans-financial-concerns-may2017/
Education Statistics
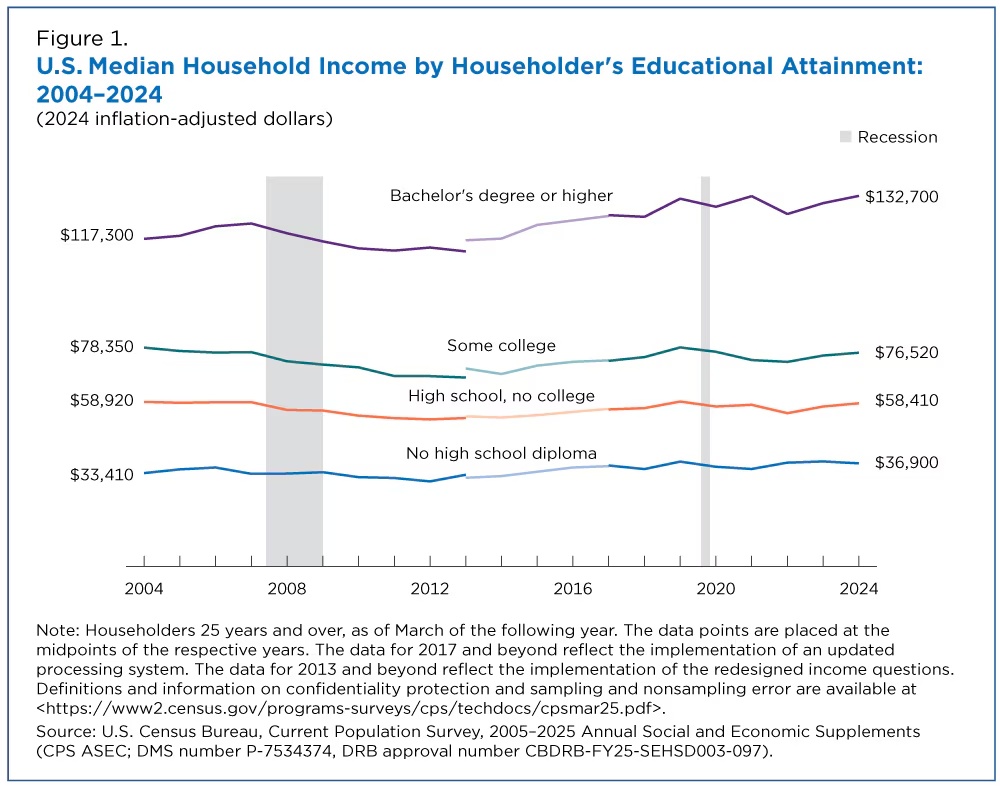
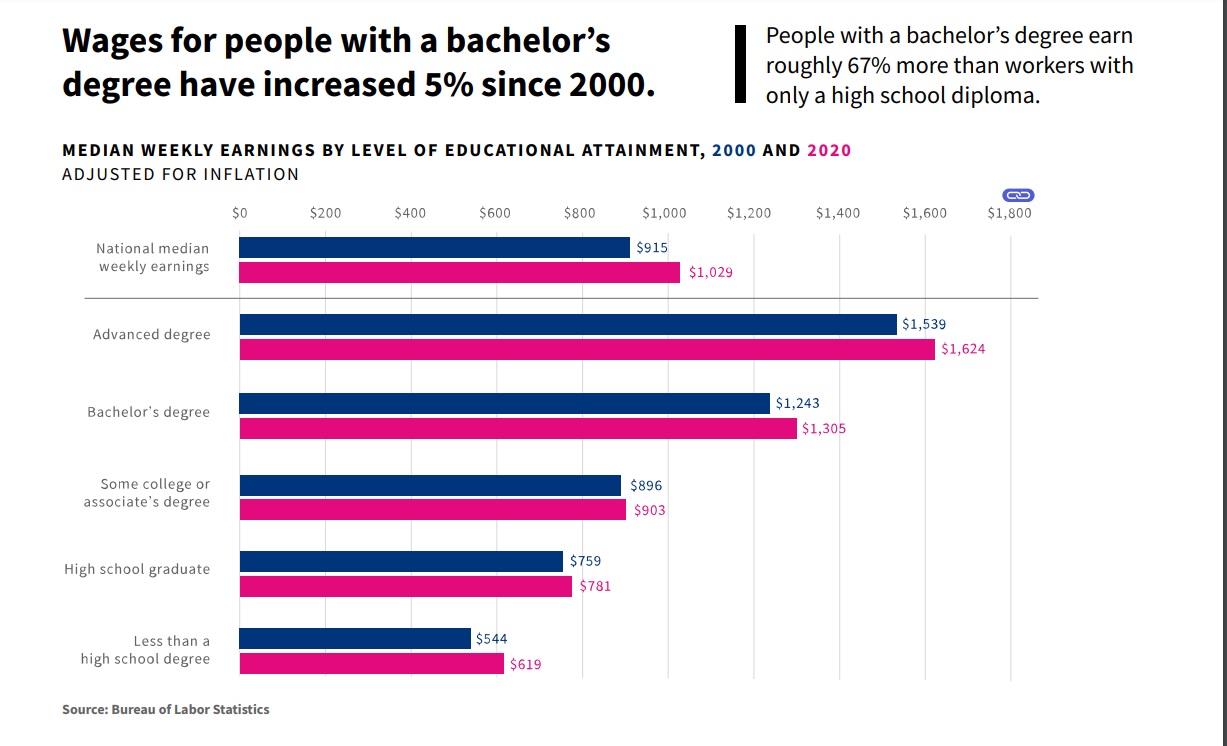
Graphic source: https://www.census.gov/library/stories/2025/09/education-and-income.html
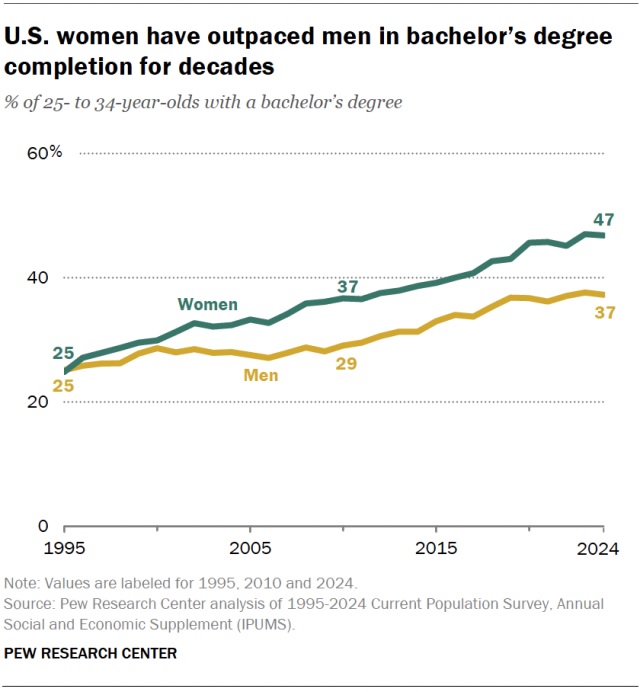
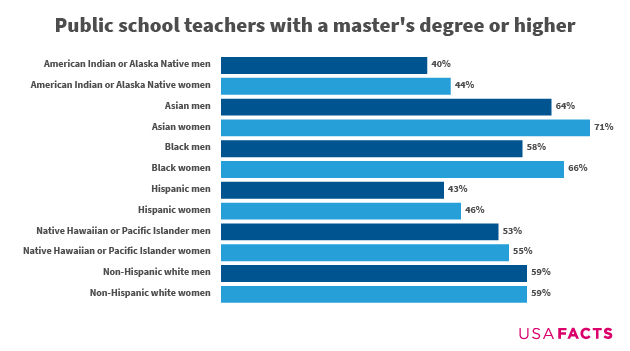
Graphic source: https://www.pewresearch.org/short-reads/2024/11/18/us-women-are-outpacing-men-in-college-completion-including-in-every-major-racial-and-ethnic-group/
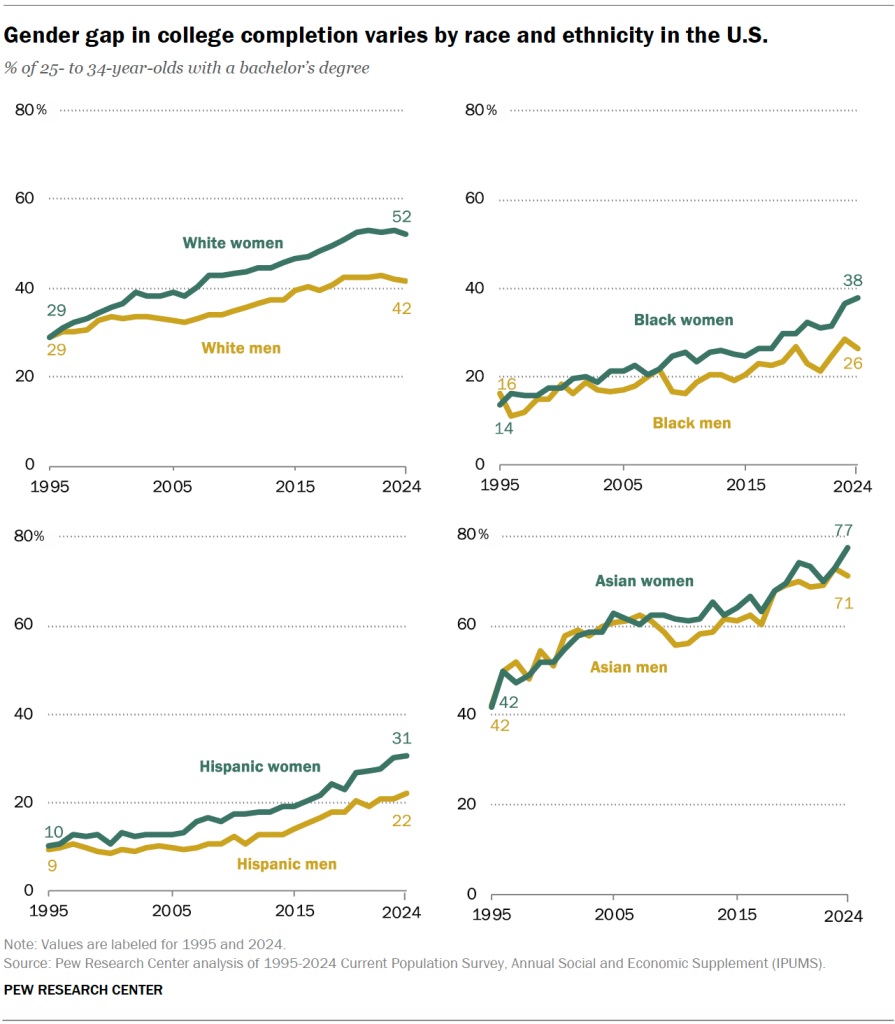
Graphic source: https://www.pewresearch.org/short-reads/2024/11/18/us-women-are-outpacing-men-in-college-completion-including-in-every-major-racial-and-ethnic-group/
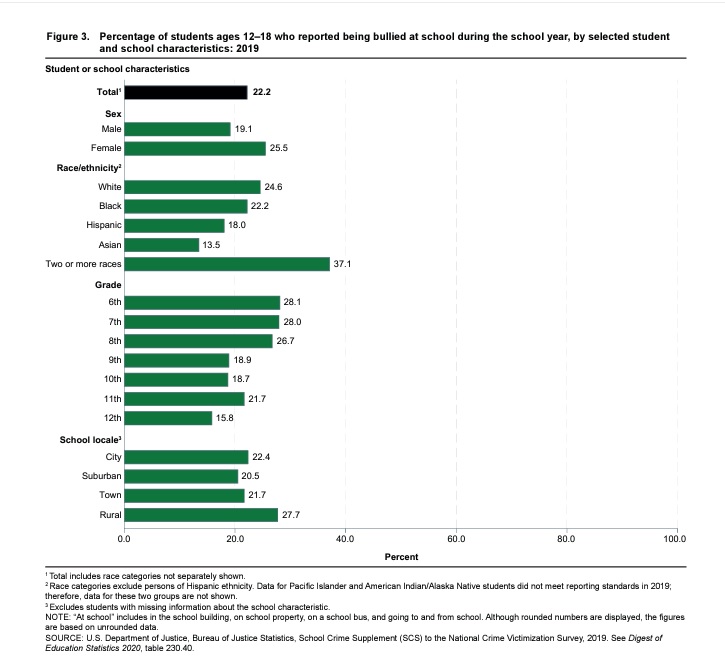
Graphic source: https://bjs.ojp.gov/sites/g/files/xyckuh236/files/media/document/iscs21.pdf
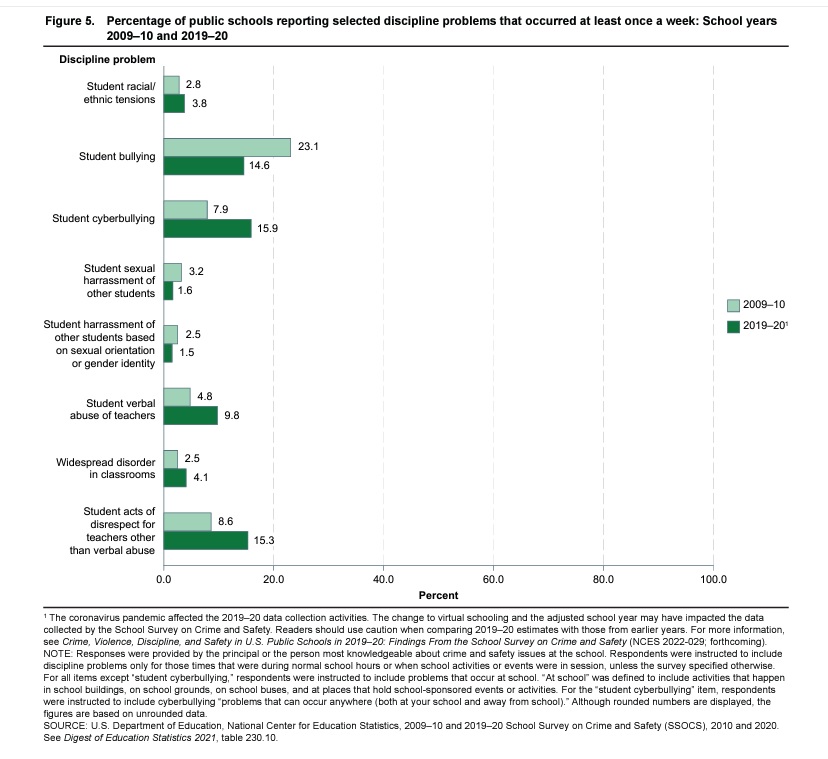
Graphic source: https://bjs.ojp.gov/sites/g/files/xyckuh236/files/media/document/iscs21.pdf
Graphic source: https://bjs.ojp.gov/sites/g/files/xyckuh236/files/media/document/iscs21.pdf

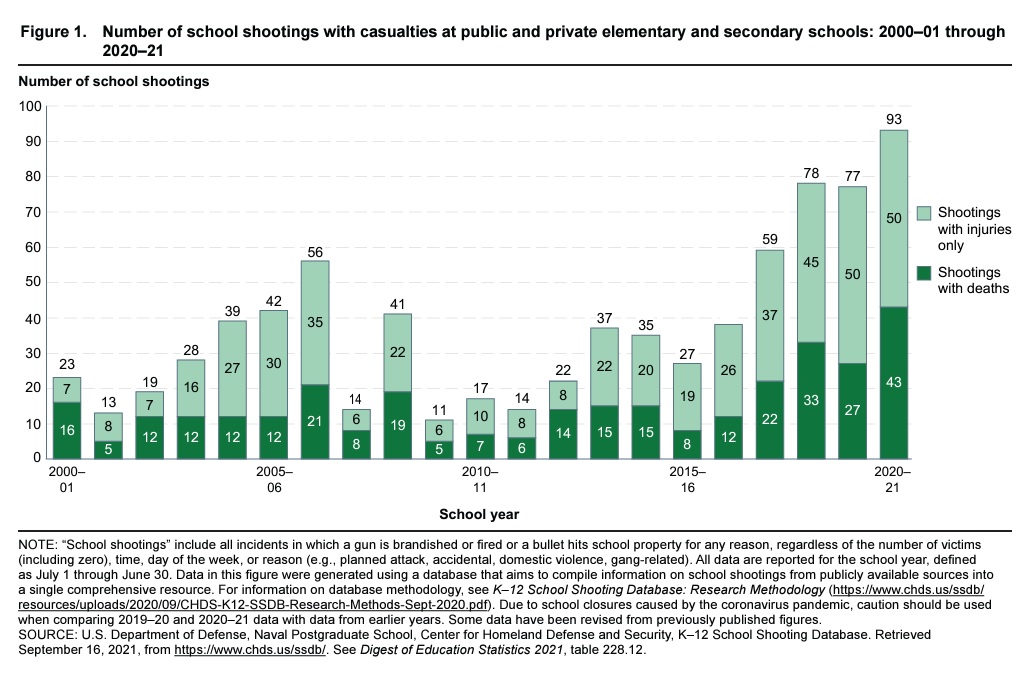
Graphic source: https://usafacts.org/annual-publications/annual-report-2021/
Graphic source: https://usafacts.org/annual-publications/annual-report-2021/
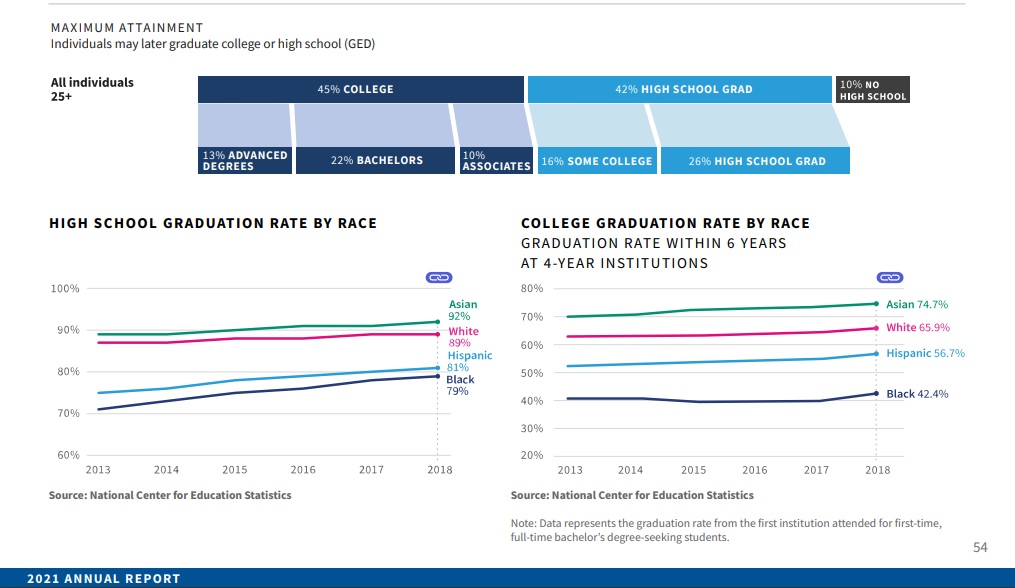
Graphic source: https://usafacts.org/annual-publications/annual-report-2021/
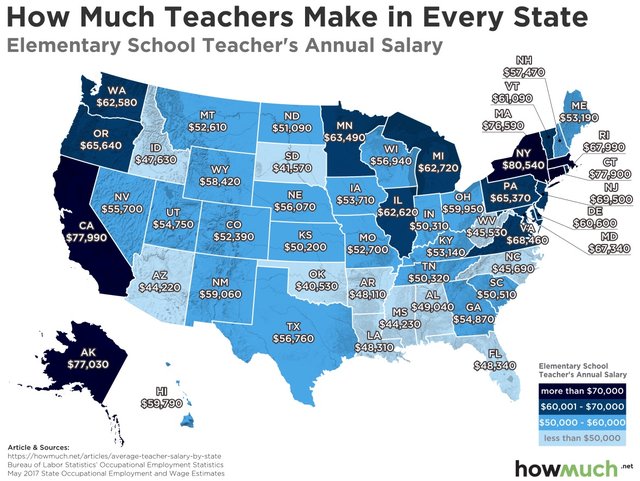
Graphic source: https://www.thrillist.com/news/nation/average-teacher-salary-in-every-state

Graphic source: https://www.thrillist.com/news/nation/average-teacher-salary-in-every-state

Graphic source: https://www.thrillist.com/news/nation/average-teacher-salary-in-every-state
- Income Gap Between Householders With College Degrees and Those With High School Degrees but No College Widened Over Last Two Decades 9/2025
-
100+ Statistics on Crime in US Schools
- Clearinghouse Enrollment Insights - Annual Series of Enrollment Reports January 15, 2026
- Nation's Report Card - National Center for Education Statistics
- National Student Clearinghouse Research Center - Publications Page
- Characteristics of Public and Private Elementary and Secondary School Teachers in the United States: Results From the 2017–18 National Teacher and Principal Survey 4/2020
- Completing College – National – 2018
- Completing College: A National View of Student Completion Rates—Fall 2012 Cohort
- 2015-16 Civil Rights Data Collection: School Climate & Safety, new for 2018
- 2018's States with the Best & Worst School Systems Wallethub.com
- Average Teachers’ Earnings Declining, Lower Than Similarly Educated Workers 7/2022
- Condition of Education
The Condition of Education contains key indicators on all levels of education, labor force outcomes, and international comparisons. The indicators summarize important developments and trends using the latest statistics, which are updated throughout the year as new data become available. Spotlight indicators provide more in-depth analyses on selected topics. In addition, the more succinct Report on the Condition of Education, which highlights and synthesizes key findings from the Condition of Education, is also available in PDF format.
- Current Term Enrollment Estimates (CTEE) Report. 12/2020
- Education Pays 2016 - The Benefits of Higher Education for Individuals and Society College Board
- 2016 Building a Grad Nation Report 7/2016
- First Look: KEY DATA HIGHLIGHTS ON EQUITY AND OPPORTUNITY GAPS IN OUR NATION'S PUBLIC SCHOOLS 2016
- The 2015 National School Climate Survey - The Experiences of Lesbian, Gay, Bisexual, Transgender, and Queer Youth in Our Nation's Schools
- 5 facts about America's students Pewresearch.org
- Alternative School Discipline Strategies 1/2018
- BREAKING SCHOOLS' RULES: A Statewide Study of How School Discipline Relates to Students Success and Juvenile Justice Involvement 2011
- Civil Rights Data Collection
- College and Career Readiness of U.S. High School Graduates 3/2016
- College Completion Chronicle.com
- Incidence of Victimization at School and Away From School 5/2022
- Knocking at the College Door 10th edition 12/2020
- Report on Indicators of School Crime and Safety: 2021 6/2022
- The Programme for International Student Assessment (PISA) is a triennial international survey which aims to evaluate education systems worldwide by testing the skills and knowledge of 15-year-old students.
- Collegeresults.Org The Education Trust - Student Graduate Rates at four-year colleges and universities
- Educational Attainment: Indicators on Children and Youth 12/2014 Childtrends.org
- Education and Income United States, 2009 and 2011 MMWR 11/2013
- ERIC Database
- National Assessment of Educational Progress (NAEP) Ed.gov
- Fast Facts National Center for Education Statistics
- High School Dropout Rates 11/2015
-
Indicators of School Crime and Safety: 2019 7/2020
- Indicators of
School Crime and Safety: 2017 3/2018
- National Assessment of Educational Progress NCES.ed.gov
- National Center for Education Statistics Ed.gov
- National Center for Education Statistics Search Ed.gov
- Profile America: Back to School 2012-2013 Census.gov
- Program for International Student Assessment (PISA) Ed.gov
- Profile of 2007-08
First-Time Bachelor's Degree Recipients in 2009 Ed.gov
- Reading Proficiency 11/2015
- The Condition of Education Ed.gov
- U.S. Department of Education
- U.S. women are outpacing men in college completion, including in every major racial and ethnic group 11/2024
Election Statistics
Federal Government Spending Statistics
Life Expectancy Statistics
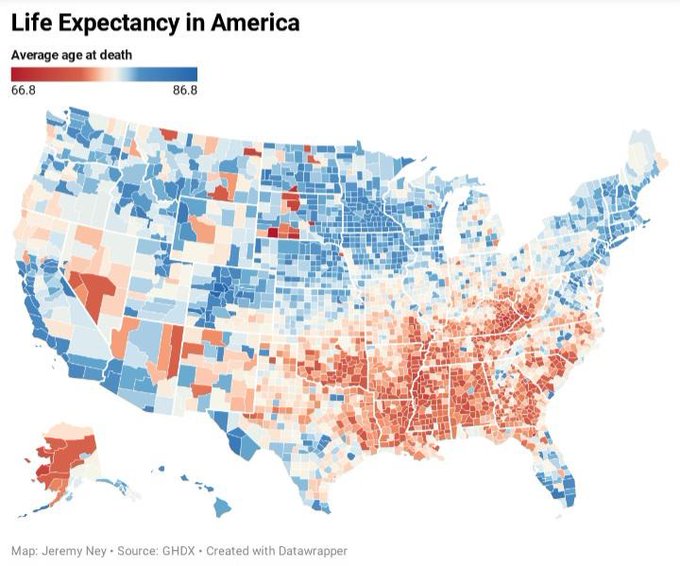

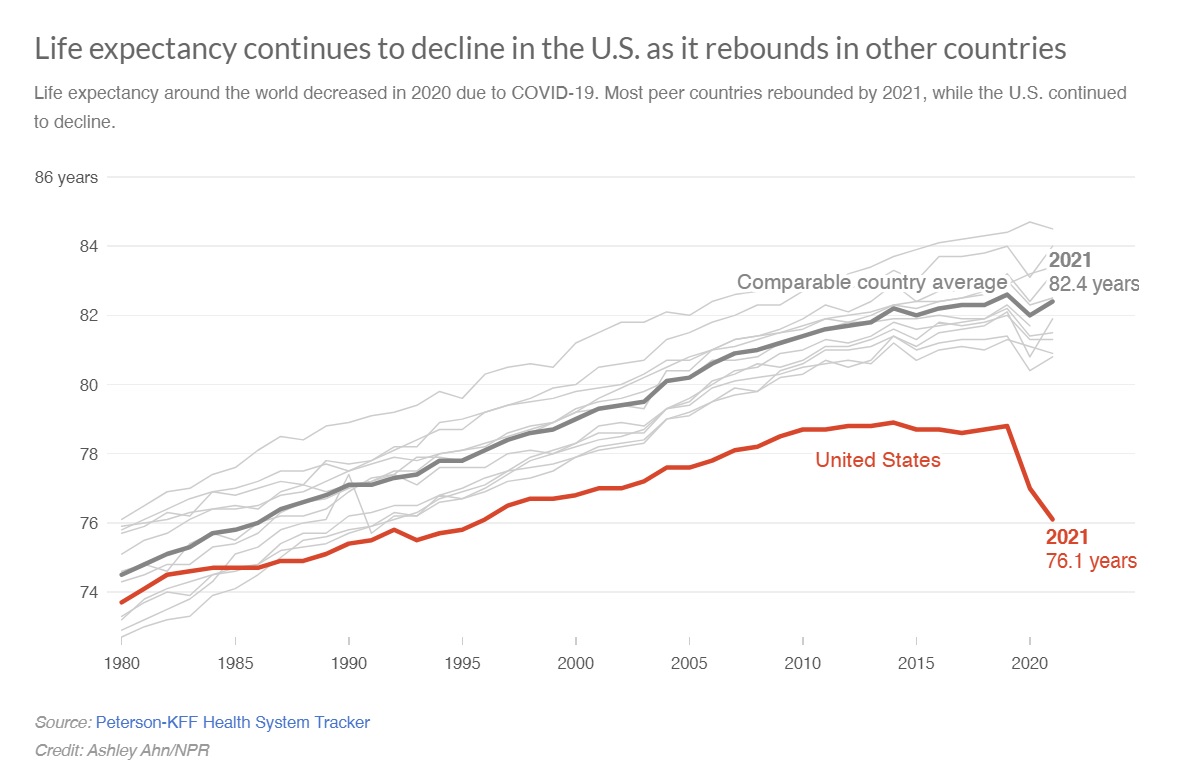
Graphic source: https://www.npr.org/sections/health-shots/2023/03/25/1164819944/live-free-and-die-the-sad-state-of-u-s-life-expectancy
Mortality Statistics
Poverty Statistics
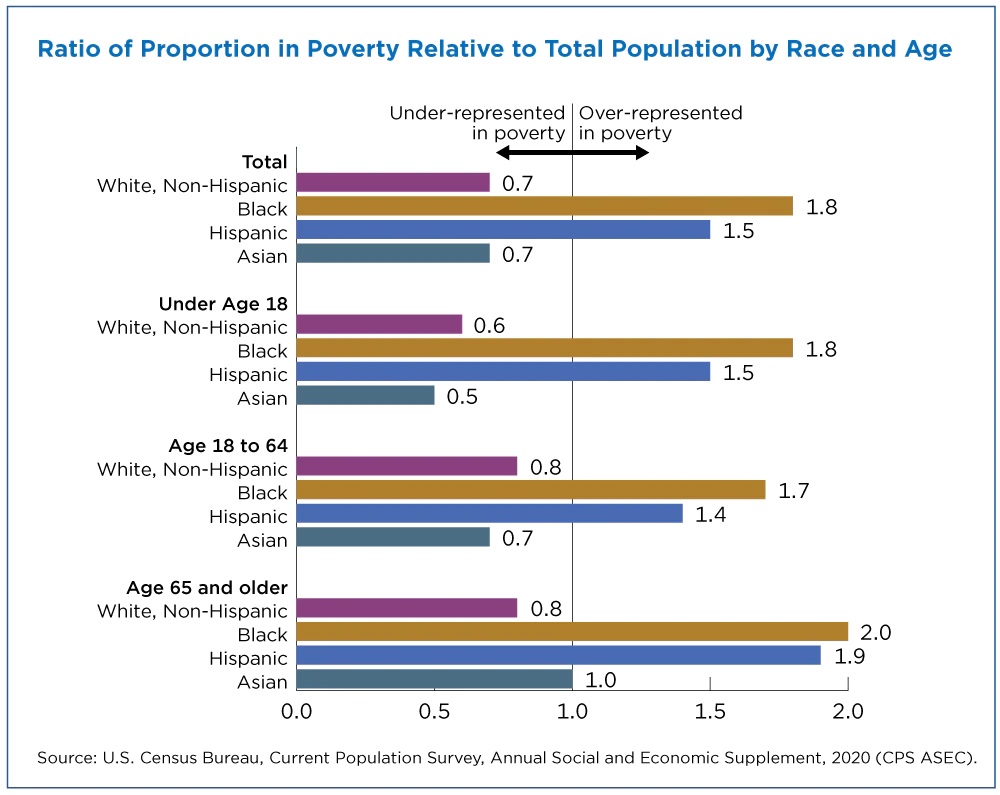
Graphic source: https://www.census.gov/library/stories/2020/09/poverty-rates-for-blacks-and-hispanics-reached-historic-lows-in-2019.html
Population Statistics - US Census
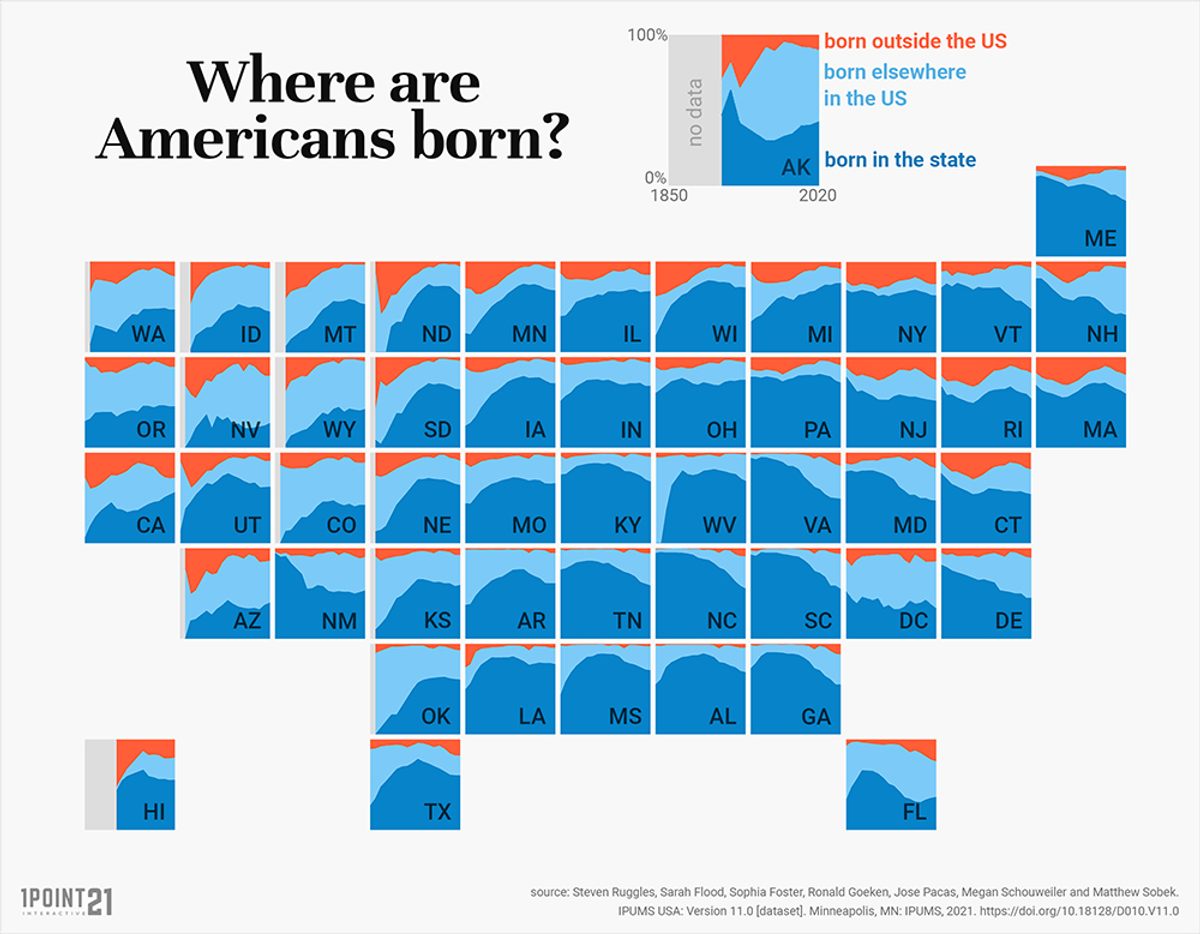
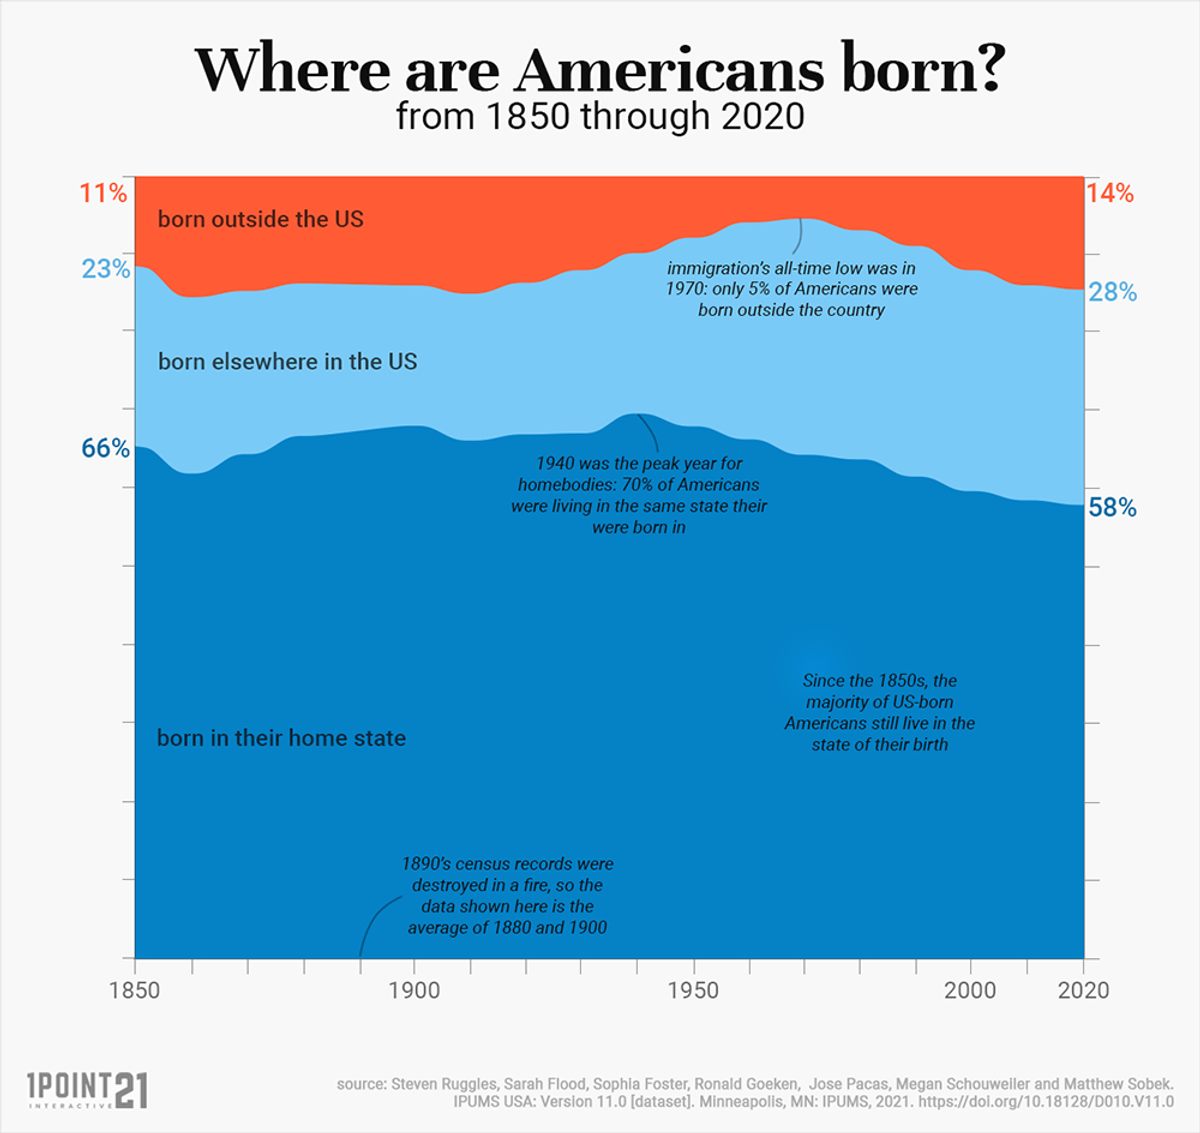
Map source: New York Times
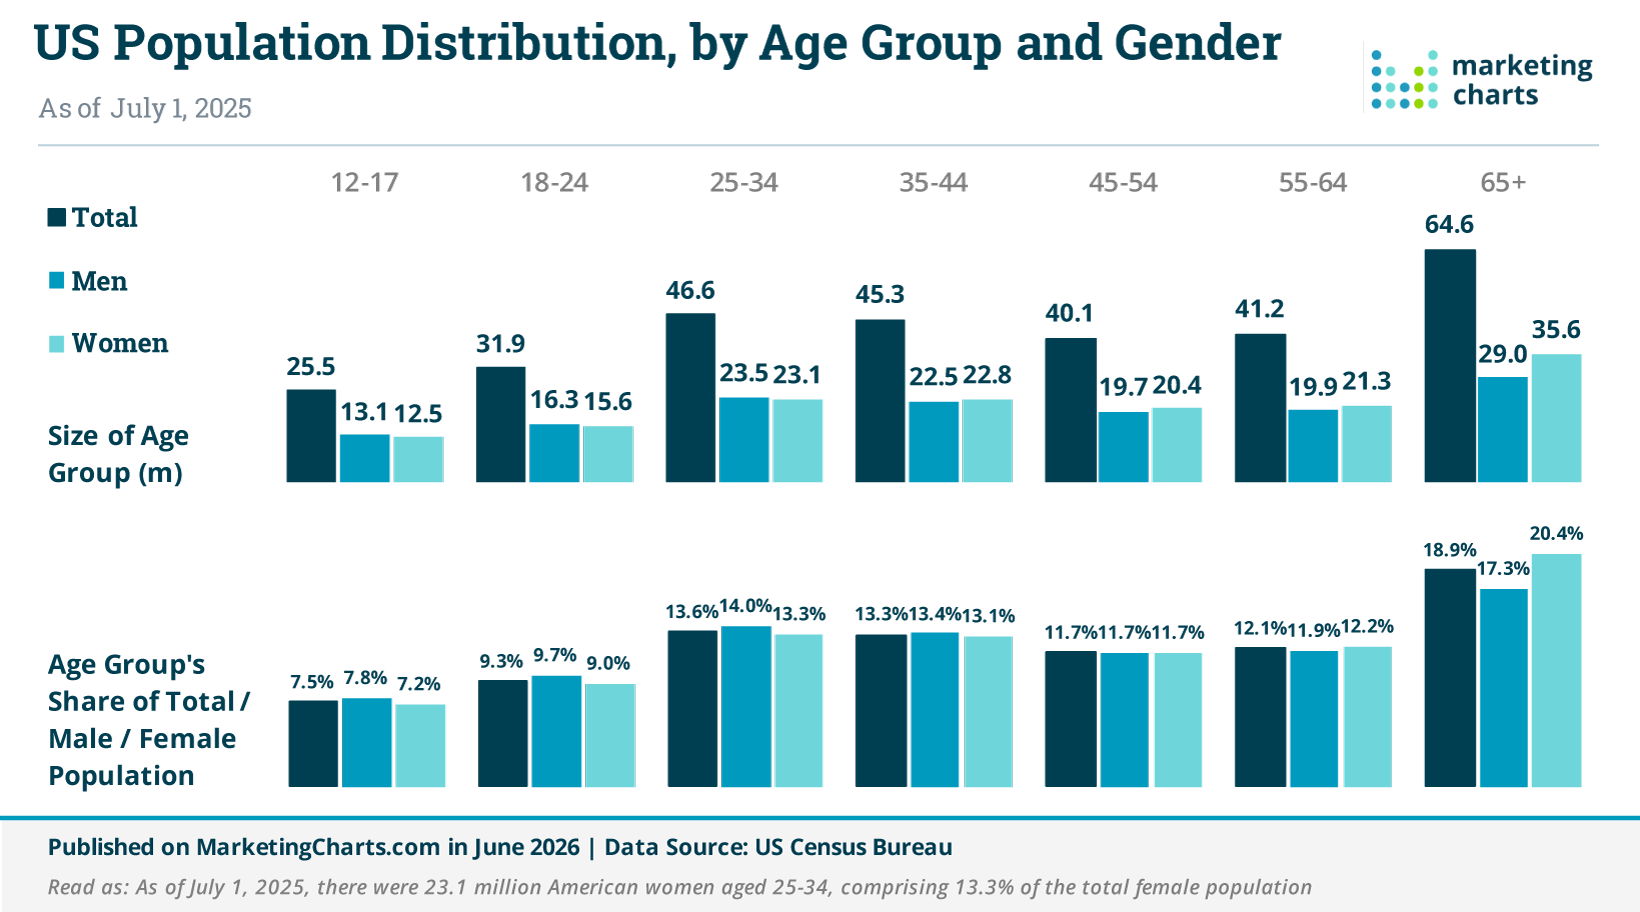
Graphic source: https://www.census.gov/library/stories/2026/04/age-and-sex.html
Graphic source: https://www.census.gov/library/stories/2026/04/age-and-sex.html
Graphic source: https://usafacts.org/articles/how-much-does-the-us-spend-on-social-security-is-it-sustainable/

Graphic source: https://www.statista.com/statistics/241488/population-of-the-us-by-sex-and-age/
Graphic source: https://www.marketingcharts.com/demographics-and-audiences/hispanic-demographics-and-audiences-231062
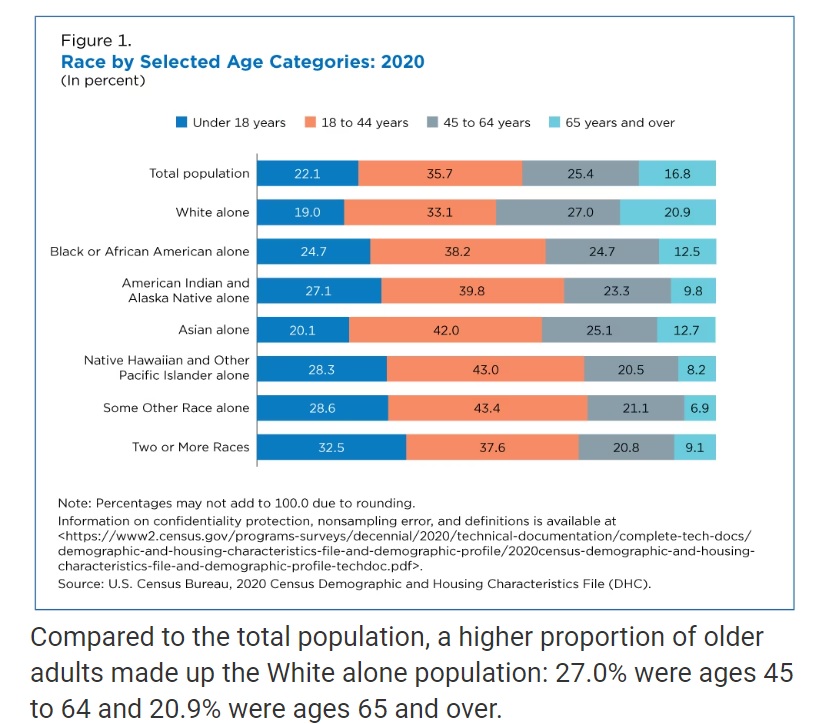
Graphic source: https://www.census.gov/library/stories/2023/06/nearly-a-third-reporting-two-or-more-races-under-18-in-2020.html
Graphic source: https://www.marketingcharts.com/featured-30401
.png)
Graphic source: https://www.marketingcharts.com/featured-30401

Graphc source: https://www.marketingcharts.com/featured-30401

Graphic source: https://www.marketingcharts.com/featured-30401
Graphic source: https://www.marketingcharts.com/demographics-and-audiences-118577
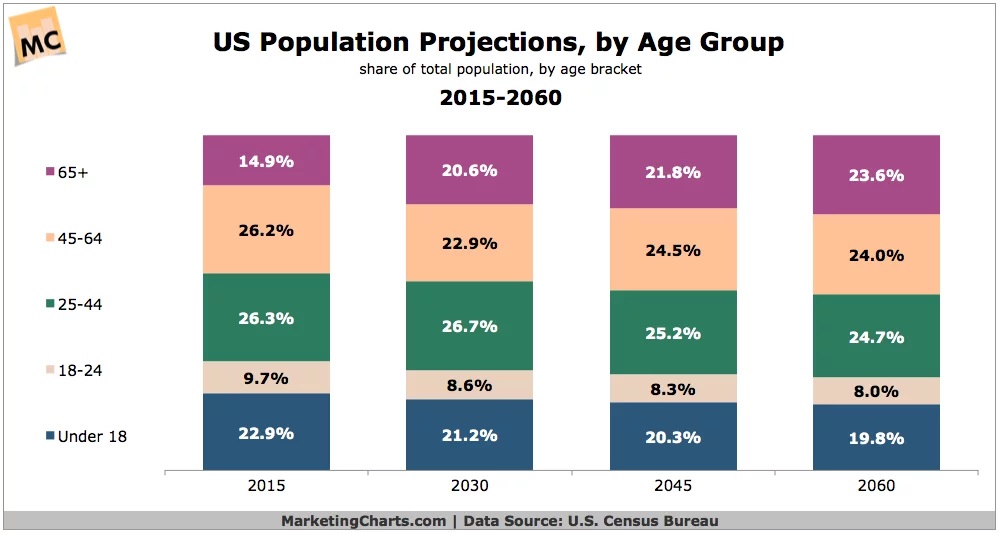
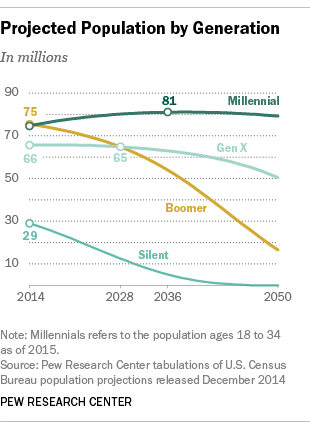
Graphic source: https://www.marketingcharts.com/demographics-and-audiences-49490/attachment/censusbureau-pop-projections-by-age-group-2015-2060-dec2014
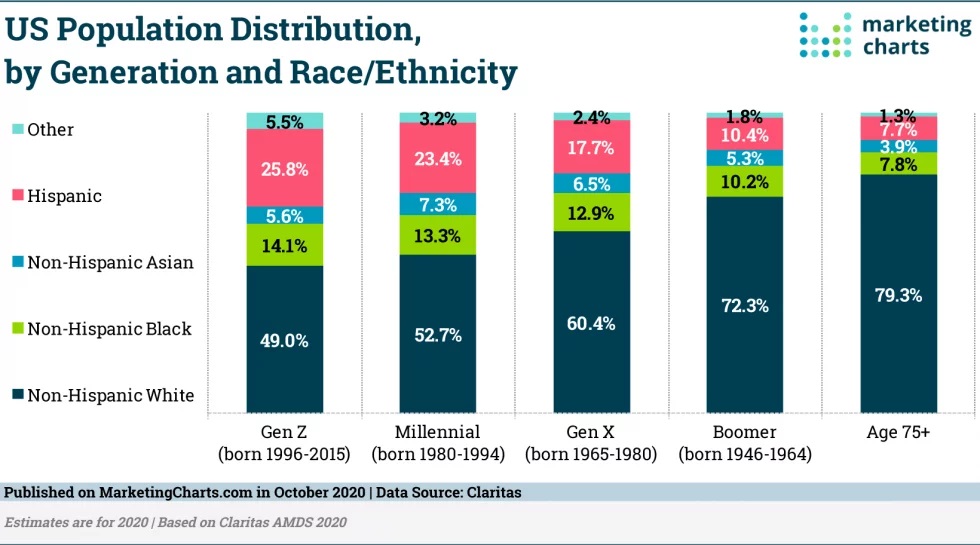
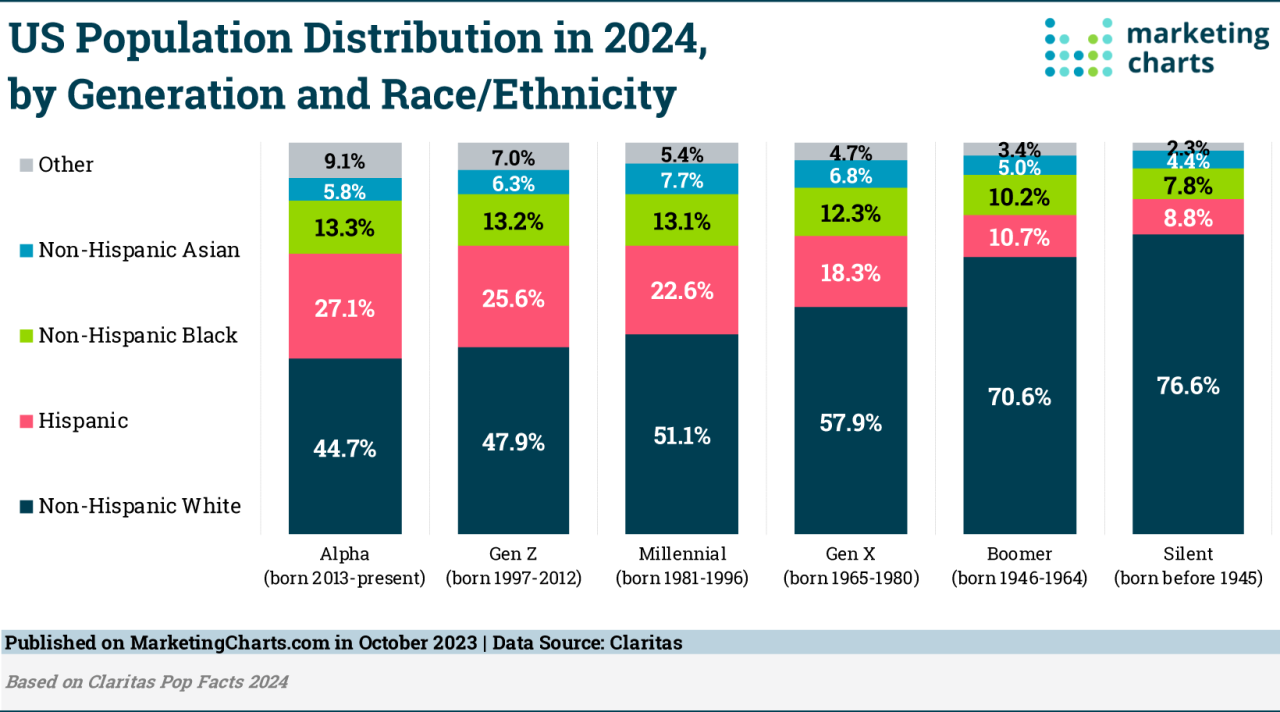
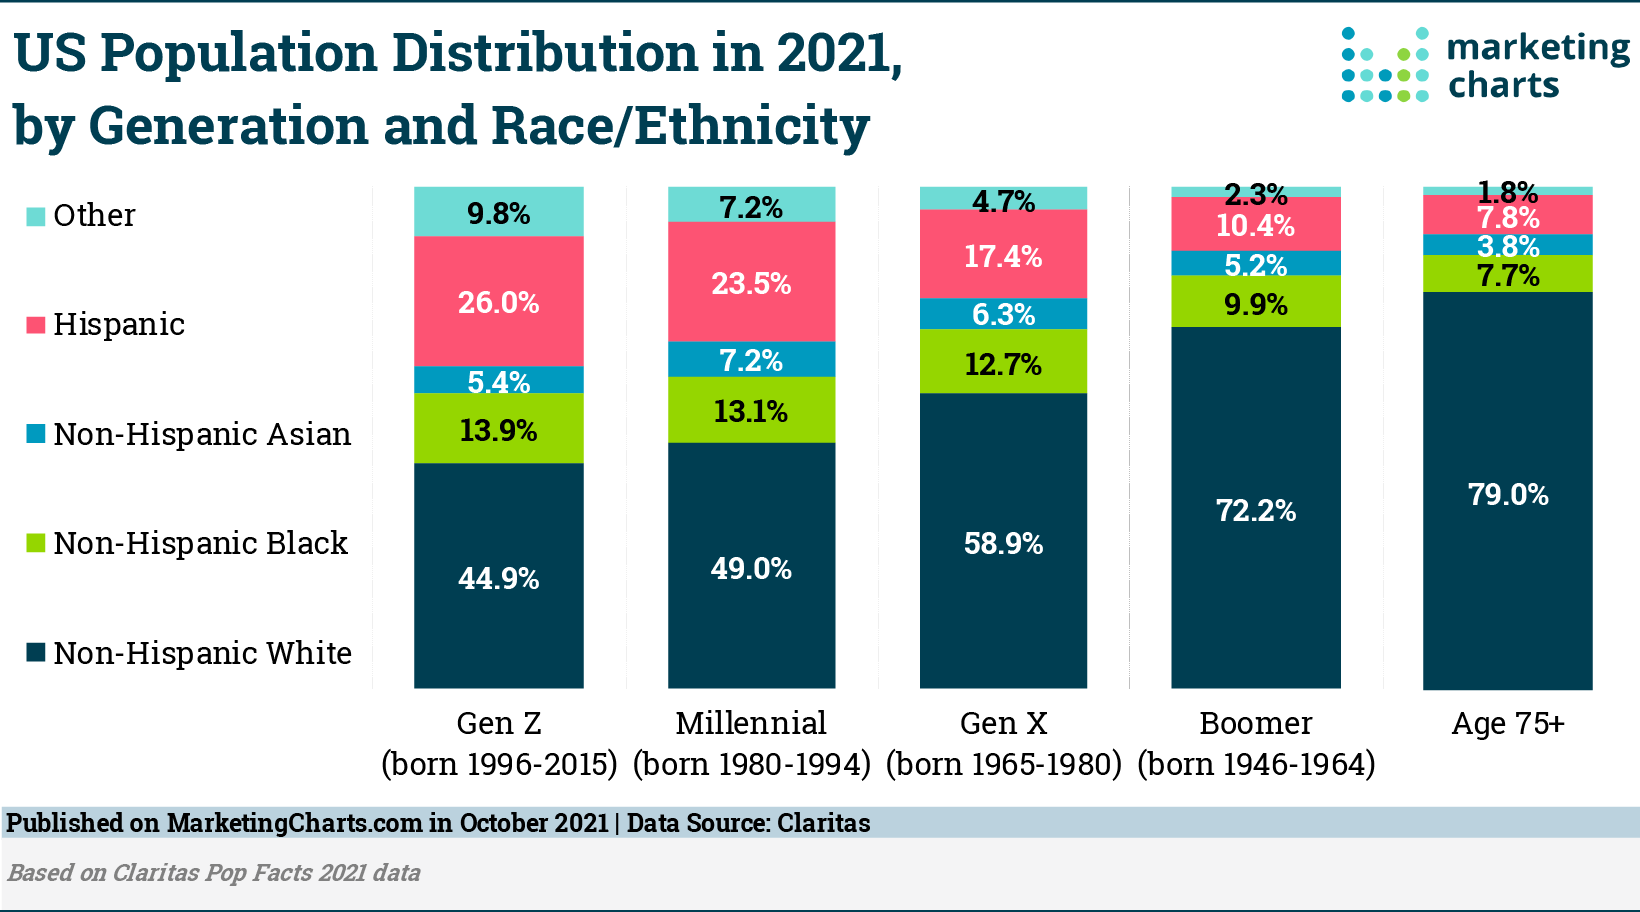
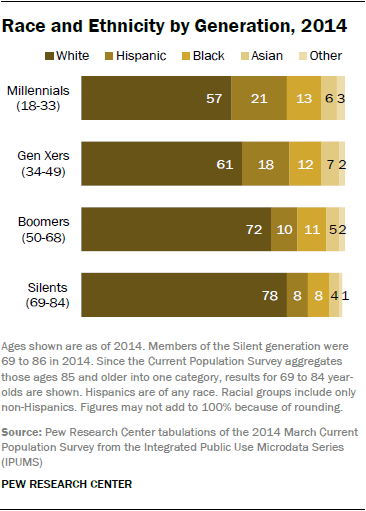
Graphic source: https://www.marketingcharts.com/charts/us-population-distribution-by-generation-and-race-ethnicity/attachment/claritas-us-pop-distribution-by-generation-race-ethnicity-oct2020
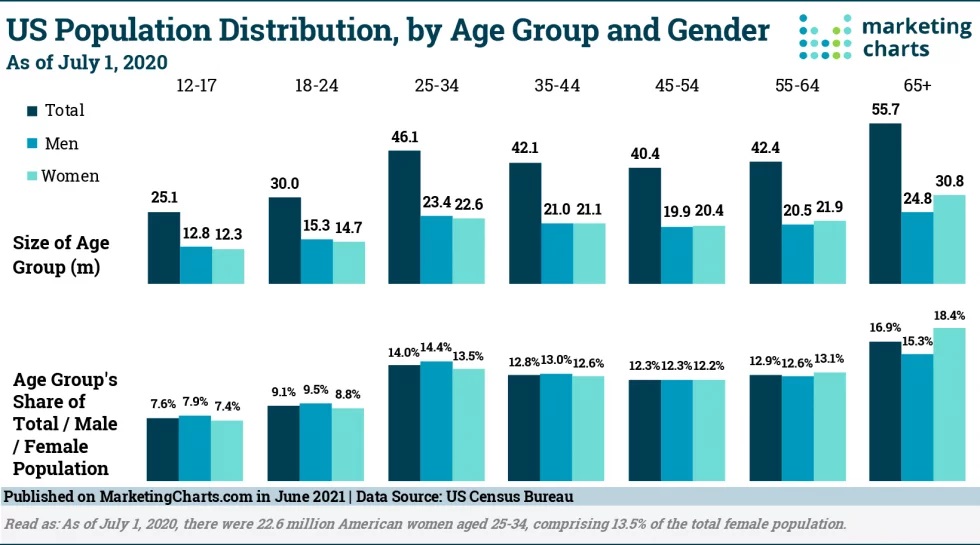
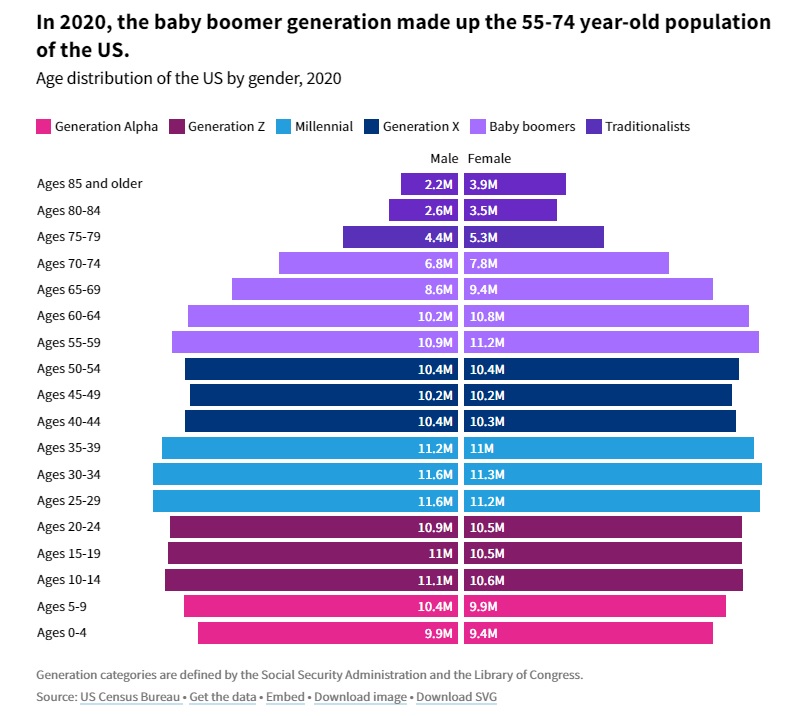
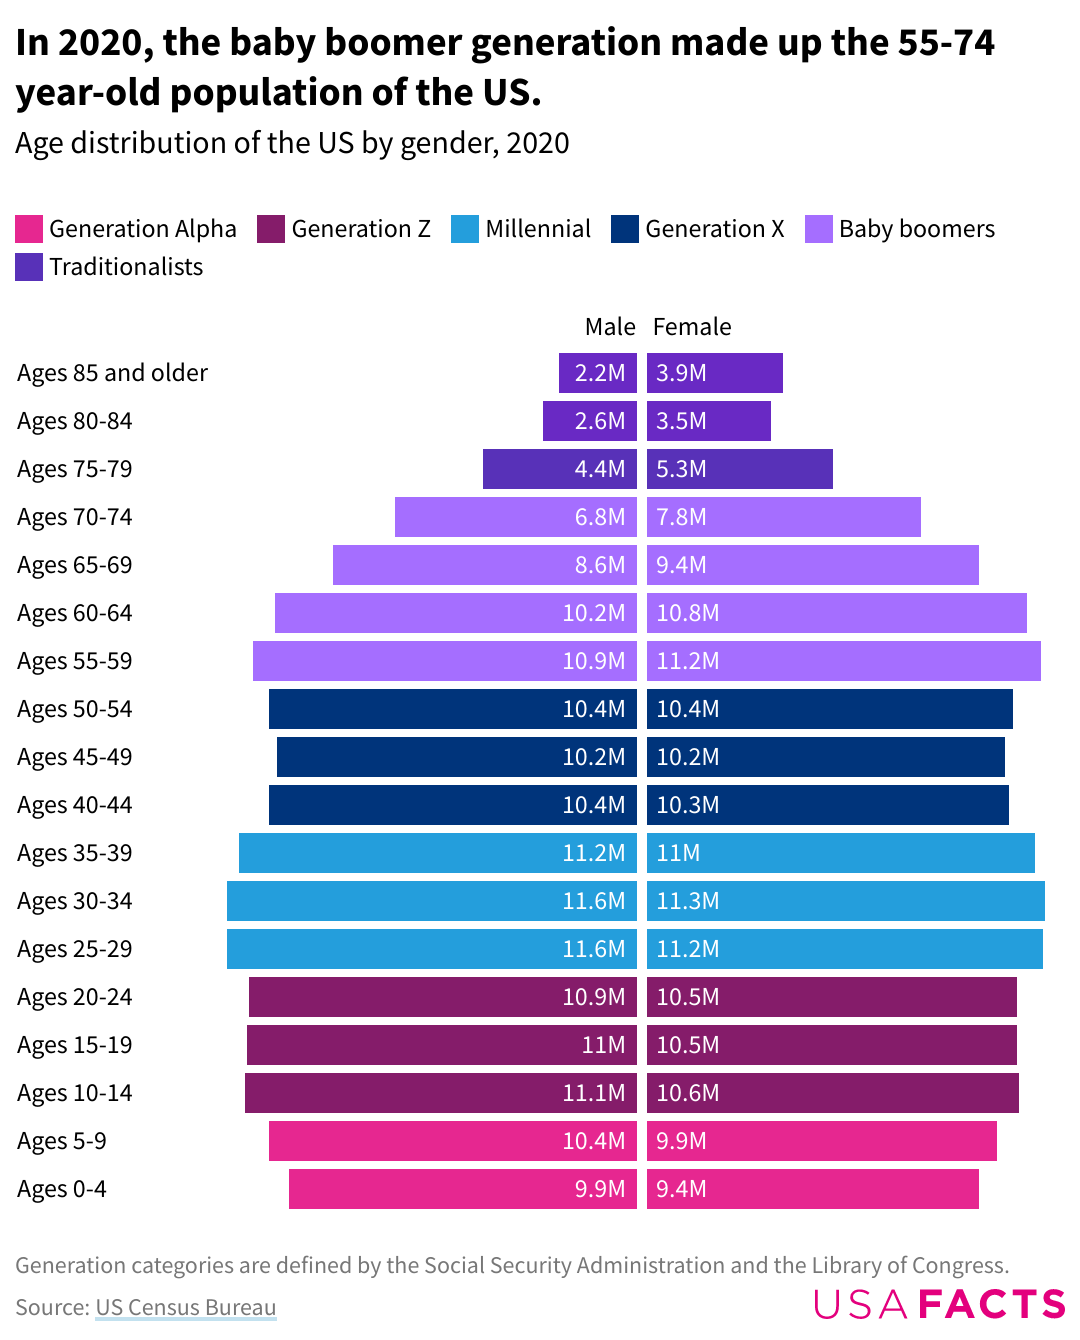
Graphic source: https://www.marketingcharts.com/charts/us-population-distribution-by-age-and-gender-in-2020/attachment/censusbureau-us-population-distribution-by-age-group-and-gender-june2021

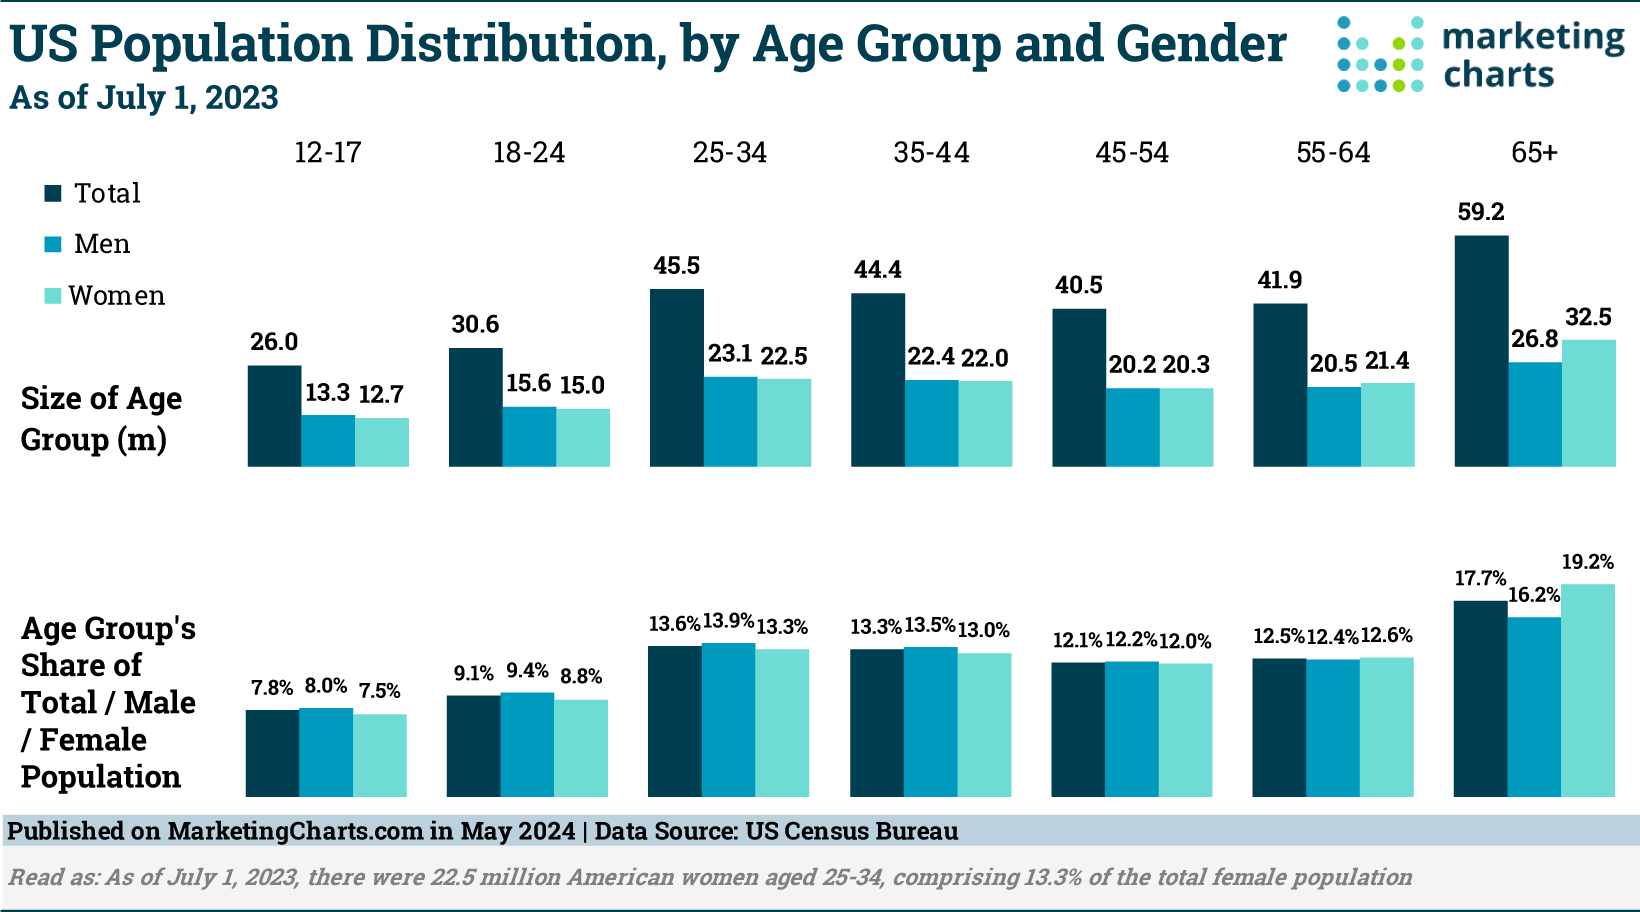
Graphic source: https://www.marketingcharts.com/charts/us-population-distribution-by-age-and-gender-in-2019/attachment/censusbureau-us-population-distribution-by-age-group-and-gender-july2020
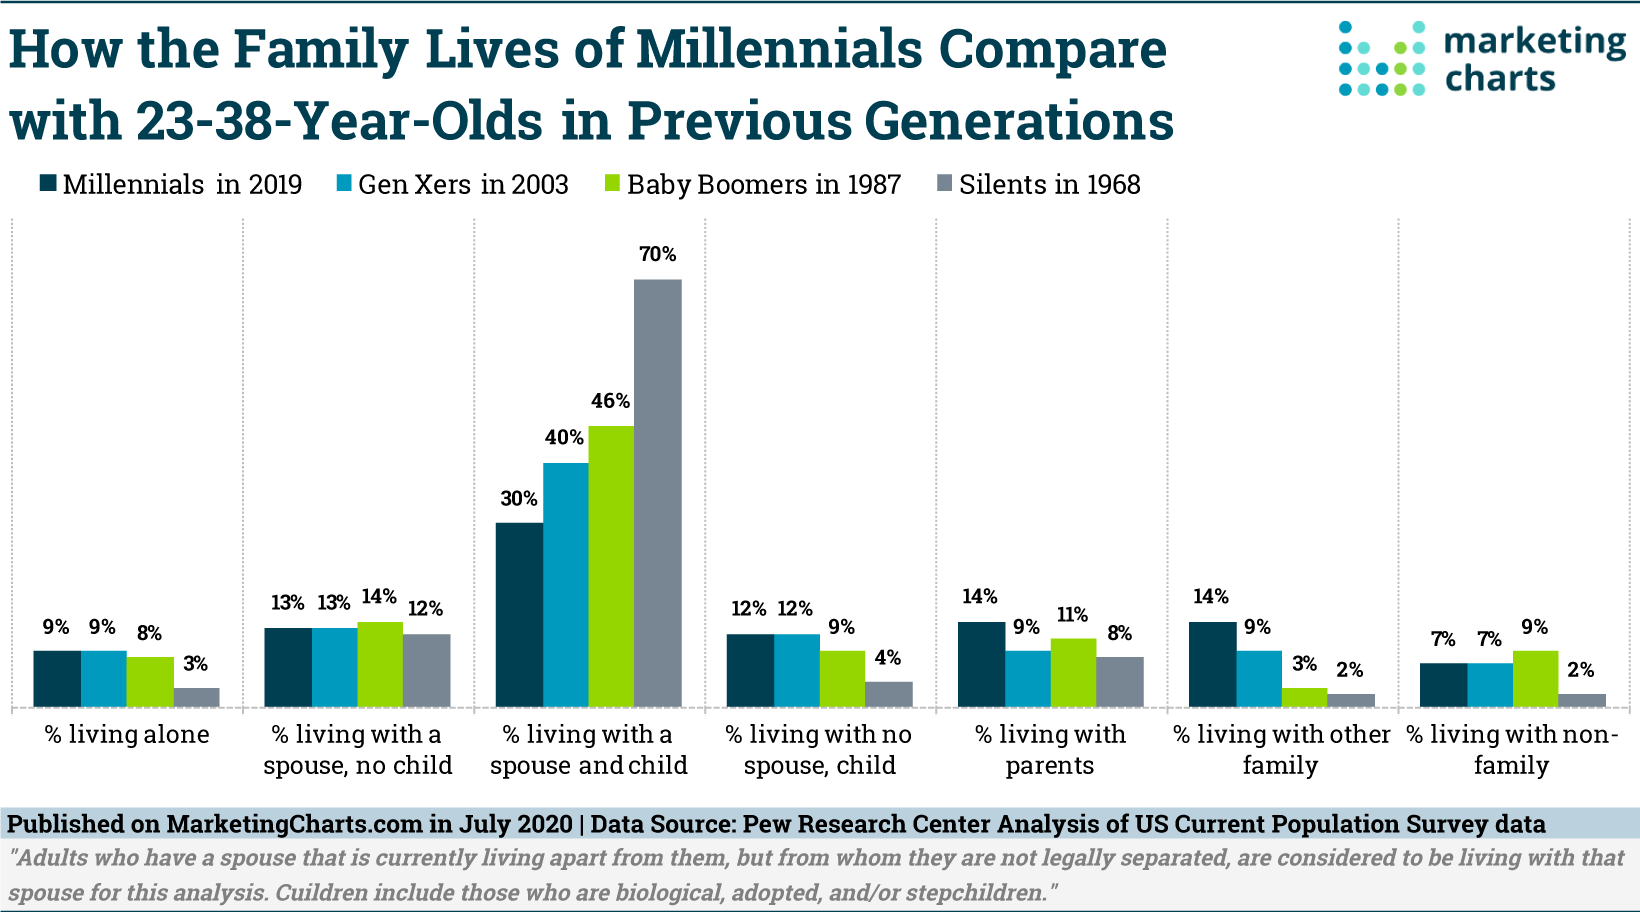
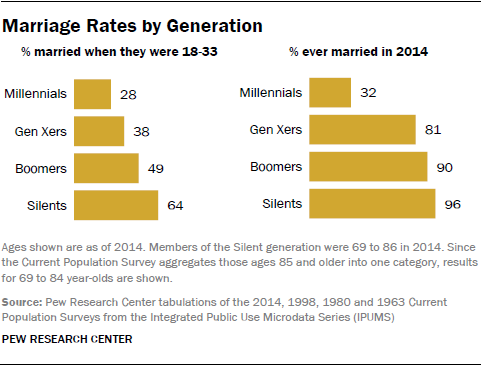
Graphic source https://www.marketingcharts.com/charts/how-the-family-lives-of-millennials-compare-with-23-38-year-olds-in-previous-generations/attachment/pewresearch-millennial-family-lives-v-other-generations-jul2020
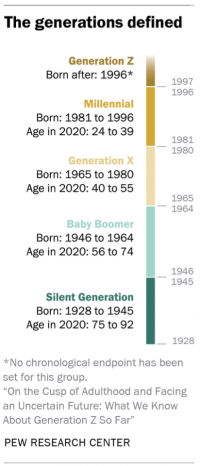
Graphic source: https://www.pewsocialtrends.org/essay/on-the-cusp-of-adulthood-and-facing-an-uncertain-future-what-we-know-about-gen-z-so-far/
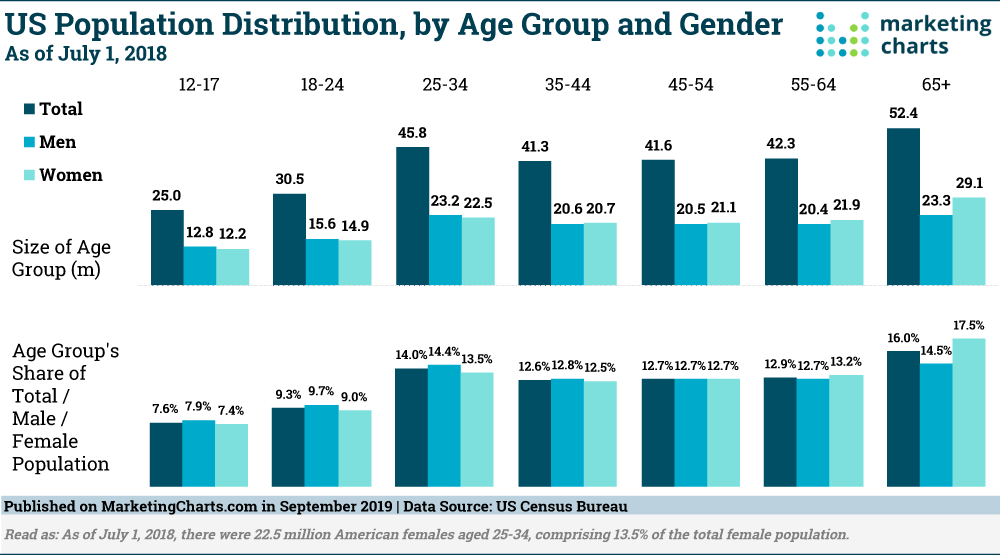
Graphic source; https://www.marketingcharts.com/charts/us-population-distribution-by-age-and-gender-in-2018/attachment/censusbureau-us-population-distribution-by-age-group-and-gender-sept2019
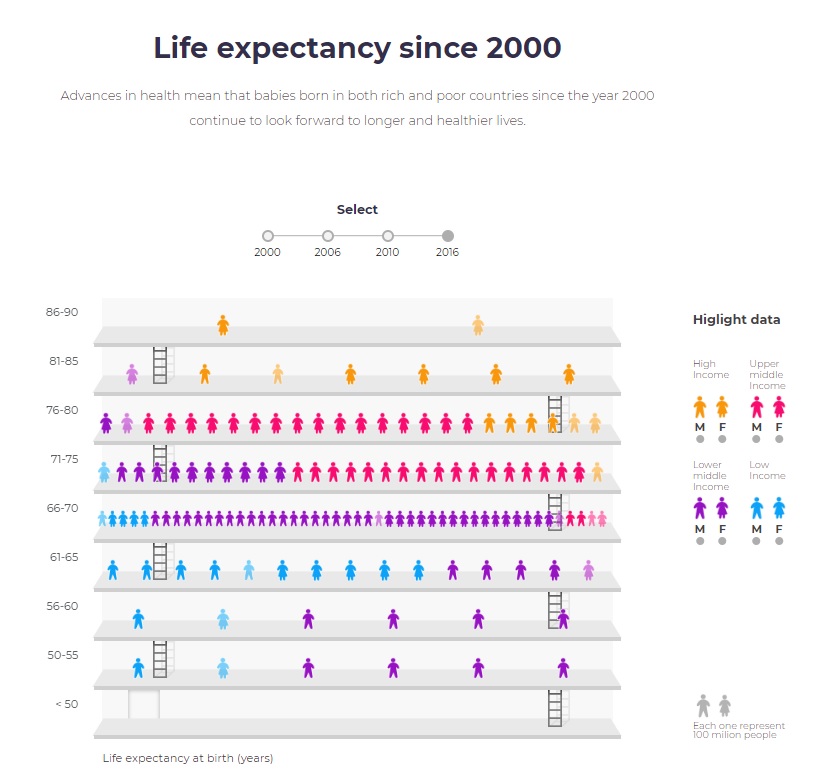
Graphic source: https://www.who.int/gho/world-health-statistics
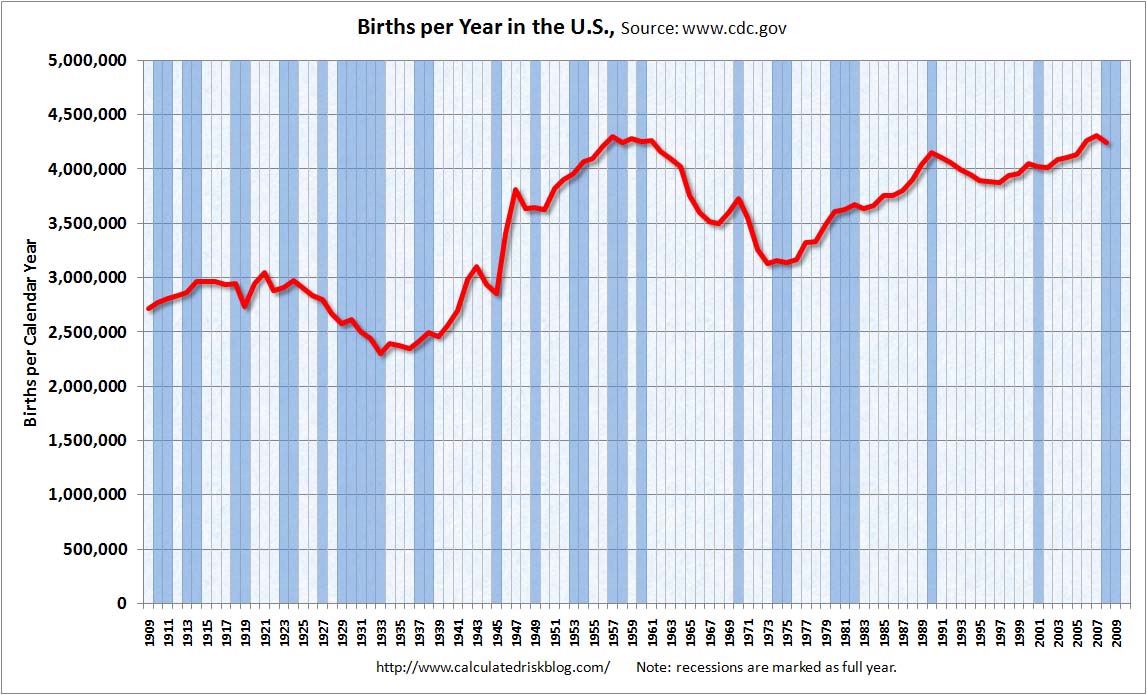
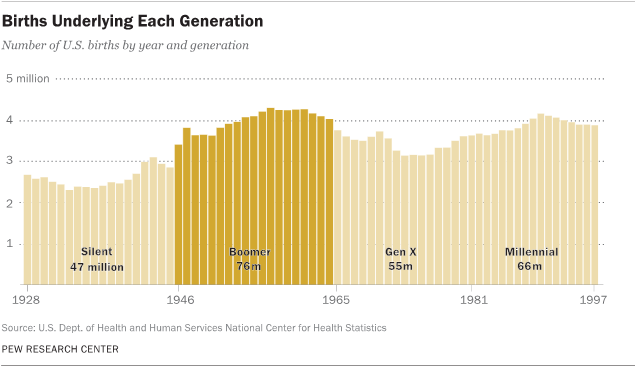
Graphic source: https://www.calculatedriskblog.com/2010/04/us-births-per-year.html

Graphic source: http://www.pewresearch.org/fact-tank/2019/01/17/where-millennials-end-and-generation-z-begins/
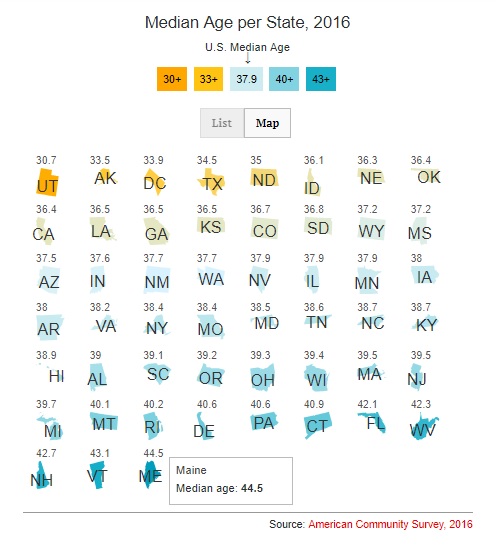
Graphic source: http://time.com/5000792/youngest-oldest-us-states/?kbid=88499
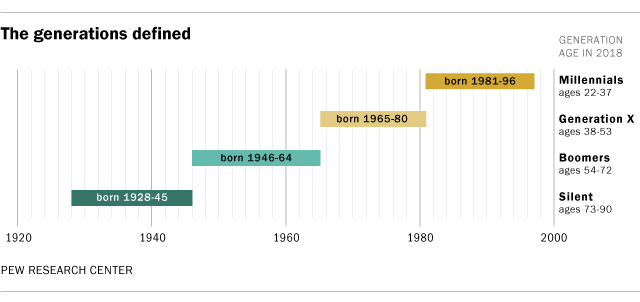
Graphic source: http://www.pewresearch.org/fact-tank/2018/03/01/defining-generations-where-millennials-end-and-post-millennials-begin/
Graphic source: http://www.people-press.org/2015/09/03/the-whys-and-hows-of-generations-research/
Graphic source: http://www.people-press.org/2015/09/03/the-whys-and-hows-of-generations-research/
Graphic source: http://www.people-press.org/2015/09/03/the-whys-and-hows-of-generations-research/
Graphic source: http://www.people-press.org/2015/09/03/the-whys-and-hows-of-generations-research/
Graphic source: http://www.marketingcharts.com/demographics-and-audiences/hispanic-demographics-and-audiences-79110

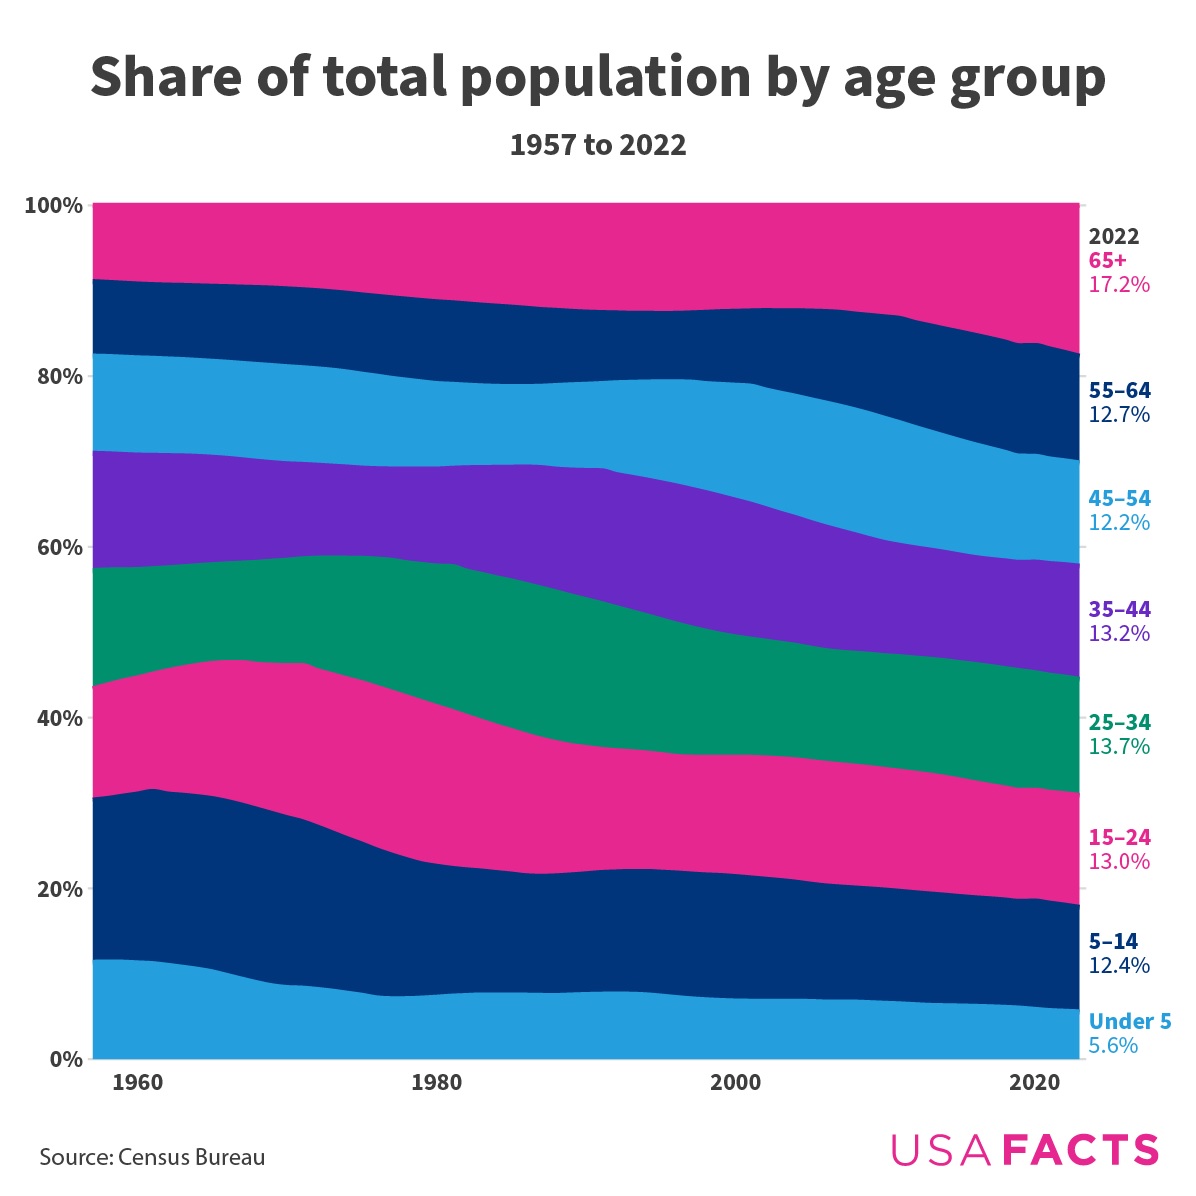
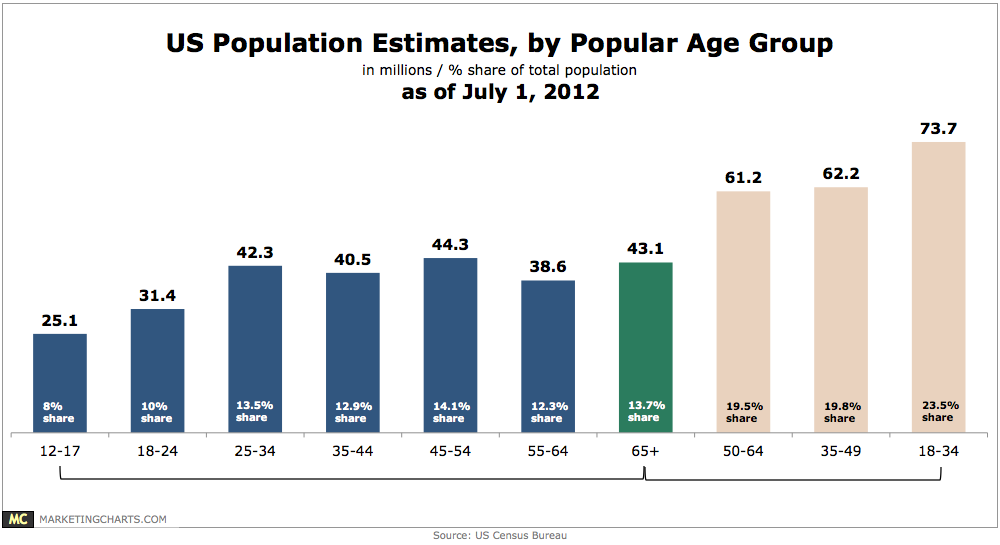
Graphic source: http://www.marketingcharts.com/traditional/so-how-many-millennials-are-there-in-the-us-anyway-30401/attachment/censusbureau-share-of-pop-by-age-group-gender-may2017/
- National Population by Characteristics: 2020-2025 4/2026 US Census
- U.S. Population Aging as Nation Turns 250 4/2026 US Census
- The oldest Baby Boomers turn 80 in 2026 1/2026
- National Population by Characteristics: 2020-2024 4/2025
- 2020 Census Shows Increase in Multiracial Population in All Age Categories 6/2023 US Census
- US Population, by Race & Ethnicity, 2014
- U.S. and World Population Clock Census.gov
- Aging Stats.gov
- A Guide to Counting Unsheltered Homeless People 2008 Hudexchange.info
- American Factfinder
- American Housing Survey
- Americans Name the 10 Most Significant Historic Events of Their Lifetimes 12/2015
- The Baby Boom Cohort in the United States: 2012 to 2060
- Census considers new approach to asking about race by not using the term at all Pewresearch.org
- Child Marriage in America Frontline.org
- Data Visualization Gallery
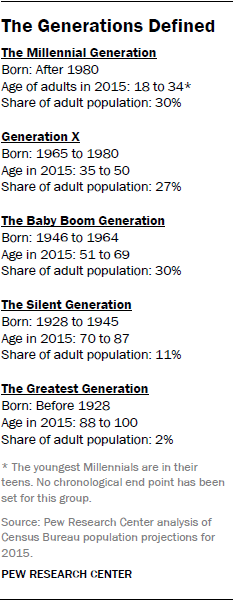
- Defining generations: Where Millennials end and Generation Z begins 1/2019
- Defining generations: Where Millennials end and post-Millennials begin 3/2018
- diversitydatakids.org
- Fertility, mortality, migration, and population scenarios for 195 countries and territories from 2017 to 2100: a forecasting analysis for the Global Burden of Disease Study 7/2020
- Generation Z Characteristics: 5 Infographics on the Gen Z Lifestyle
- How Long Do Couples Date Before Getting Engaged? 2/2016
- How Many People Are Left From the Year You Were Born
- Life Expectancy Childtrends.org
- How Many People Are Alive From the Year You Were Born
- How Millennials today compare with their grandparents 50 years ago PEWresearch.org
- Millions of Americans changed their racial or ethnic identity from one census to the next PEWresearch.org
- More people say they’re multiracial after taking ancestry tests 5/2021
- On the Cusp of Adulthood and Facing an Uncertain Future: What We Know About Gen Z So Far 5/2020
- The baby boom in seven charts The baby boom reshaped family life and drove population growth in many countries. 2/2025
- The Multicultural Edge:Rising Super Consumers Nielsen.com
- The Whys and Hows of Generations Research 9/2015
- Multiracial in America - Proud, Diverse and Growing in Numbers PEW.org 6/2015
- Older Americans 2012 Key Indicators of Well-Being Agingstats.gov
- Population Estimates Data Sets (State, Metropolitan, County) US Census
- Sexual Orientation and Health Among U.S. Adults: National Health Interview Survey, 2013 CDC.gov 7/2014
- The Average 29-Year-Old
- The Baby Boom Cohort in the United States: 2012 to 2060 5/2014
- The Whys and Hows of Generations Research 9/2015
- This year, Millennials will overtake Baby Boomers PEWresearch.org 1/2015
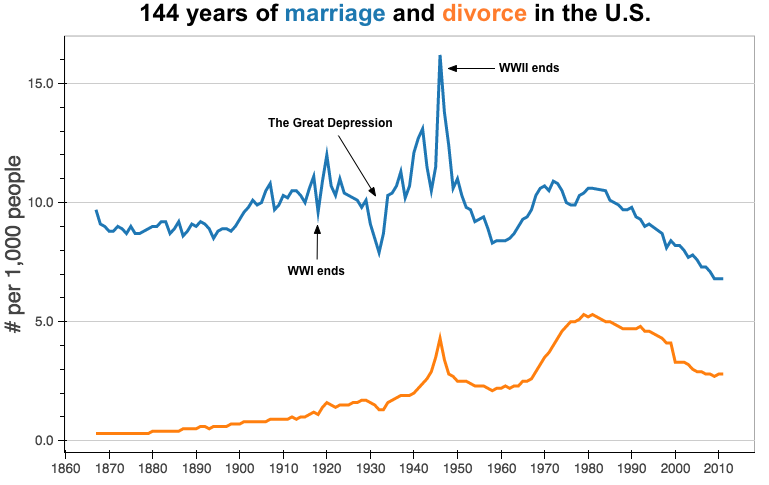
- Trends in Relationship Formation and Stability in the United States: Dating, Cohabitation, Marriage, and Divorce 5/2020
- U.S. Census
- Who Still Lives at Home with Their Parents? 12/2016
- 1940 Census
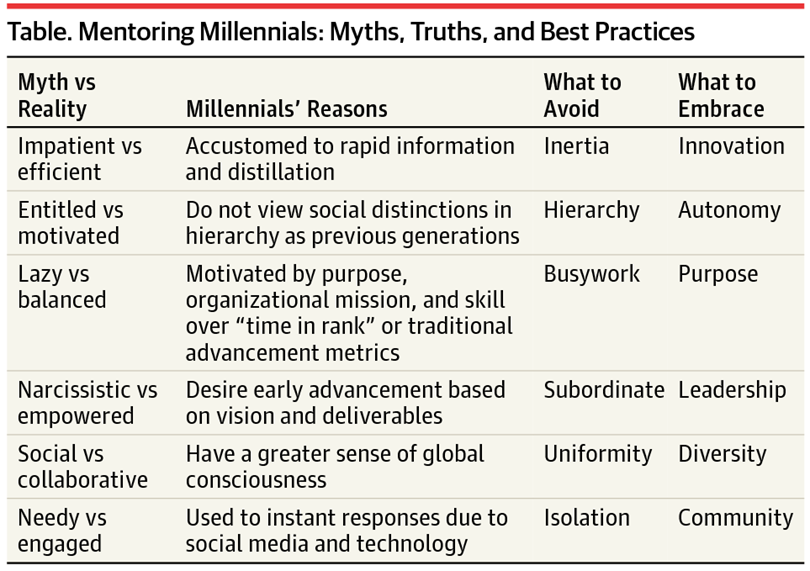
Graphic source: Mentoring Millennials
JAMA. 2018;319(15):1547-1548. doi:10.1001/jama.2018.3804

Graphic source: http://a.fastcompany.net/asset_files/-/2016/06/01/millenials.jpg

Graphic source: http://c.fastcompany.net/asset_files/-/2016/06/01/millenials-peak.jpg
Graphic source: http://www.pewresearch.org/fact-tank/2015/01/16/this-year-millennials-will-overtake-baby-boomers/
Graphic source: http://www.marketingcharts.com/wp/topics/demographics/so-how-many-millennials-are-there-in-the-us-anyway-30401/
Sociodemographics
Graphic source: https://www.atlasobscura.com/articles/states-moving-map
Graphic source: https://www.atlasobscura.com/articles/states-moving-map
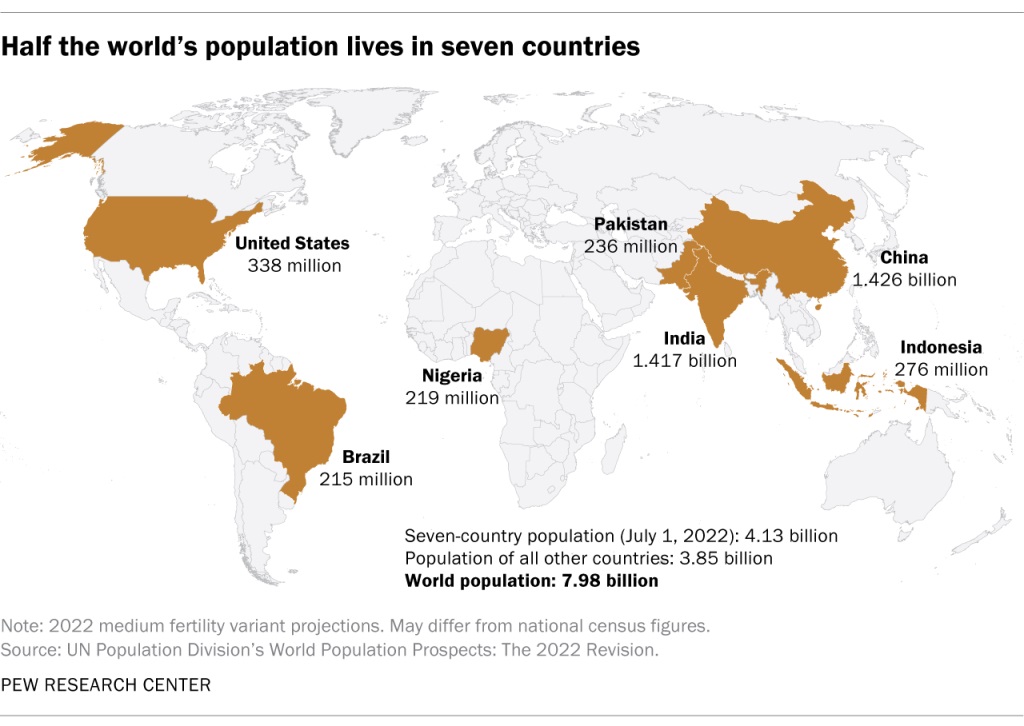
Map source: https://www.pewresearch.org/fact-tank/2022/07/21/global-population-projected-to-exceed-8-billion-in-2022-half-live-in-just-seven-countries/
FONT SIZE=1> Graphic source: WHO

Graph source: http://www.npr.org/sections/money/2013/12/09/247385046/the-global-population-boom-and-bust-in-4-gifs

Graph source: http://www.npr.org/sections/money/2013/12/09/247385046/the-global-population-boom-and-bust-in-4-gifs
Graphic source: https://priceonomics.com/why-do-brides-wear-white/
PUBLISHED ON THE WEB: August 8, 2000; February 23, 2001
R2,130
Comments, suggestions: 
Links
Back to Top
© Copyright 1999 - 2026 Betty C. Jung
All rights reserved.