
https://www.bettycjung.net/Blog2025.htm


Blogging since 2000....

|
 |
 |


|

|

Custom Search
|
Custom Search
|

|

 Please note that this page is a work in progress. Finalized entries are dated and posted on the What's New Page, and at the end of each month are returned here for archiving. So, unless an entry has a date it can still undergo metamorphosis! Thanks for your understanding. Please note that this page is a work in progress. Finalized entries are dated and posted on the What's New Page, and at the end of each month are returned here for archiving. So, unless an entry has a date it can still undergo metamorphosis! Thanks for your understanding.
|
| January - June | July - December |

Each year, Make Up Your Mind Day on December 31st encourages us to quit wavering, to take a side, and follow through with a decision and stick to it. As New Year's resolutions go, this may be the day to decide which ones to declare. The day may be used to determine other decisions as well.

From 11:30 p.m. on December 31st to 12:30 a.m. on January 1st each year, Universal Hour of Peace hopes to take a step toward a war-free world.
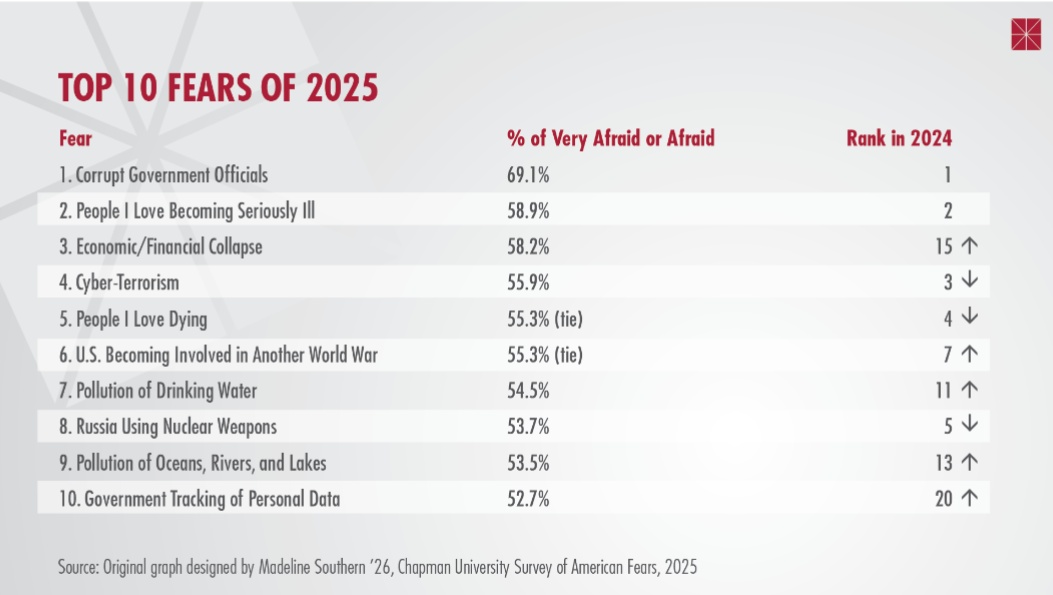
Graphic source: https://www.chapman.edu/wilkinson/research-centers/babbie-center/_files/2025/Key-Findings-Survey-of-America-Fears-2025.pdf

Graphic source: https://www.statista.com/chart/33394/most-widespread-fears-in-the-us/
In Memoriam: Stars We Lost in 2025 IMDB
IMDB - Remembering Artists We Lost in 2024
Celebrity Deaths 2023 USAToday.com
Celebrity Deaths in 2023: Stars We've Lost USmagazine.com
Celebrity Deaths in 2022: Stars We've Lost USmagazine.com
Celebrity deaths 2023: All the actors, singers and more we lost this year Pagesix.com
Celebrity deaths 2022: All the actors, singers and more we lost this year Pagesix.com
Gone But Not Forgotten - 2023 Deaths Fiftiesweb.com
Gone But Not Forgotten - 2022 Deaths Fiftiesweb.com

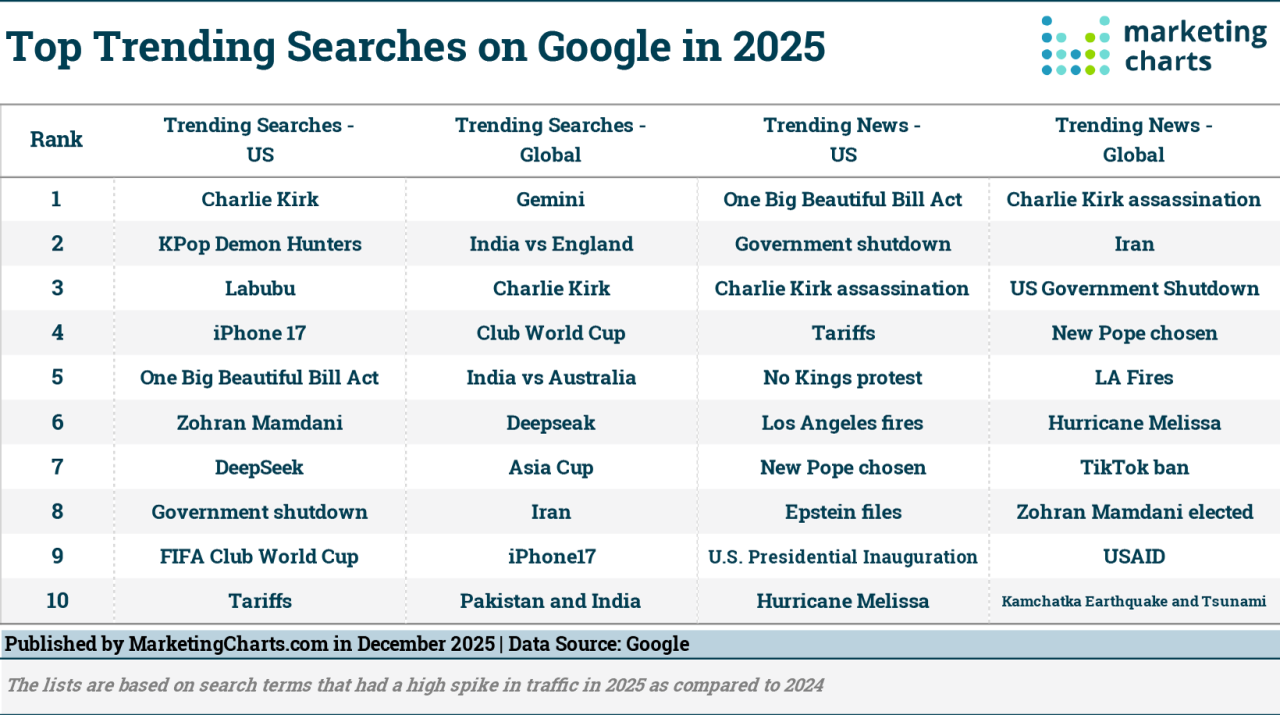
Graphic source: https://www.marketingcharts.com/digital/seo-237486

Graphic source: https://www.marketingcharts.com/digital/seo-234537

Graphic source: https://www.visualcapitalist.com/the-most-viewed-wikipedia-pages-in-2024/

Graphic source: https://www.visualcapitalist.com/year-in-review-what-made-the-news-in-america-in-2024/

Graphic source: https://www.statista.com/chart/28936/the-year-in-google-searches-global/
Year in Search 2023 12/2023
Year in Search 2022 12/2022

Graphic source: https://en.247mirror.com/world-really-intriguing-perspective-charts
Source: Google Reveals the Most Popular Search Terms for 2020

Graphic source: https://www.visualcapitalist.com/top-news-2023-google-search-trends/

Graphic source: https://www.marketingcharts.com/digital/seo-231643

Graphic source: https://www.marketingcharts.com/featured-228160

Graphic source: https://www.marketingcharts.com/featured-119313?mc_cid=24a102fc4a&mc_eid=92b613e289

Graphic source: https://www.marketingcharts.com/charts/top-trending-searches-on-google-in-2020/attachment/google-top-trending-searches-of-2020-dec2020

Graphic source: https://en.247mirror.com/world-really-intriguing-perspective-charts
Google - Year in Search 2025
Google - Year in Search 2024
Year in Review 2023 | Inspired by Google Year in Search
Google - 25 Years in Search - The Most Searched
Google - 2023 Year in Search
Google - 2022 Year in Search
Google - 2021 Year in Search
Google - 2020 Year in Search
Google - 2019 Year in Search
December 30, 2025

One photo from every week of 2023 Reuters
Photos of 2023 and the stories behind them Reuters via @SpecialReports
The year in photos: AP's most memorable photos of 2023 12/2023 AP
Rolling Stone's Best Photos of 2022
The Year in Pictures New York Times
2022 in pictures: Striking photos from around the world BBC
2022: The Year in Pictures CNN
2022: The year in pictures NY Post
The Year 2022: The year in photos ABC
A look at AP's Photos of the Year 2022
2022 - See our most striking original illustrations and photography of the year NBCNews
2021 - The Year in Pictures NBCNews
2020 - The Year in Pictures NBCNews
2019 - The Year in Pictures NBCNews

Graphic source: https://www.statista.com/chart/16275/holiday-music-fans-by-age/
The Best Holiday Videos Ever! Yahoo.com

Put up a "Do Not Disturb" sign on your door and ban all interruptions

Graphic source: https://nationaldaycalendar.com/december-26-2019-boxing-day-national-whiners-day-national-thank-you-note-day-national-candy-cane-day/


Graphic source: https://weather.com/storms/winter/news/2020-12-16-winter-storm-gail-snow-photos
Band Aid 30
Band Aid 1984
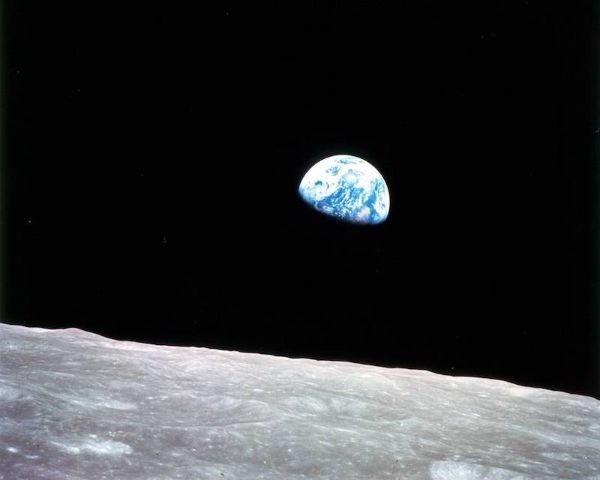
Photo Source: https://earthsky.org/space/apollo-8-earthrise-december-24-1968-new-simulation/

Graphic source: https://www.noradsanta.org/

Graphic source: https://www.noradsanta.org/en/
Using data to determine if Die Hard is a Christmas movie 12/2021


Graphic source: https://earthsky.org/earth/everything-you-need-to-know-december-solstice

Graphic source: https://en.es-static.us/upl/2015/12/BreathingEarth1.gif

Graphic source: http://earthsky.org/earth/everything-you-need-to-know-december-solstice

Graphic source: http://earthsky.org/earth/everything-you-need-to-know-december-solstice

Graphic source: http://earthsky.org/earth/everything-you-need-to-know-december-solstice
For more information, see Solstices & Equinoxes for Boston (Surrounding 10 Years)
The 50 Best Christmas Movies of All Time @Thrillist


Graphic source: https://earthsky.org/human-world/apollo-17-last-human-footsteps-on-the-moon-dec-14-1972/

Graphic source: https://earthsky.org/human-world/apollo-17-last-human-footsteps-on-the-moon-dec-14-1972/


For more information, see Study finds 90 percent of American men overfat
December 13, 1937 - The Rape of Nanking
<>
Graphic source: https://encyclopedia.thefreedictionary.com/Nanking%20Massacre


#PearlHarborRemembranceDay


The outbreak of COVID-19: An overview NIH.gov February 12, 2020
December 1, 2019: First Case of COVID-19 Appeared in Wuhan | FRewind
Wuhan: How the COVID-19 Outbreak in China Spiraled Out of Control
First Case of 2019 Novel Coronavirus in the United States NEJM.org January 31, 2020

Graphic source: https://www.cdc.gov/flu-resources/php/nivw/?CDC_AAref_Val=https://www.cdc.gov/fl

2017 Map of Cybercrime Victims on Cyber Monday

Map source: https://www.techrepublic.com/article/cyberattacks-most-likely-to-happen-in-these-10-states-on-cyber-monday/
For more information, see Cyberattacks most likely to happen in these 10 states on Cyber Monday 11/2017


Graphic source: https://www.sru.edu/news/113018b

Graphic source: https://www.cdc.gov/hiv/library/awareness/wad.html

Graphic source: https://www.statnews.com/2021/11/30/despite-interventions-black-and-hispanic-men-are-contracting-hiv-at-the-same-rates-as-10-years-ago/

Graphic source:https://www.hiv.gov/hiv-basics/overview/data-and-trends/global-statistics
For more information, see World AIDS Day

For more information, see Remembrance Day for Lost Species


For more information, see National Native American Heritage Month - November and November is National American Indian Heritage Month Library of Congress


Graphic source:https://www.census.gov/newsroom/stories/native-american-heritage-day.html
For more information, see Native American Heritage Day: November 28, 2025 U.S. Census

Graphic source: https://nationaldaycalendar.com/november-29-2019-buy-nothing-day-black-friday-electronic-greetings-day-national-day-of-listening-national-native-american-heritage-day-youre-welco/

Graphic source: https://www.squawkfox.com/blackfriday/


November 28th is Red Planet Day to commemorate the lauch of Spacecraft Mariner 4.
Feast Day of St. Catherine Laboure, the patron saint of the elderly, infirmed people and the Miraculour Medal.

You can create your family health portrait record, for free, at: My Family Health Portrait Site
For step-by-step instructions, see Family Health Portrait The more you know about your family's health history, the better you can take care of yourself and your kids!
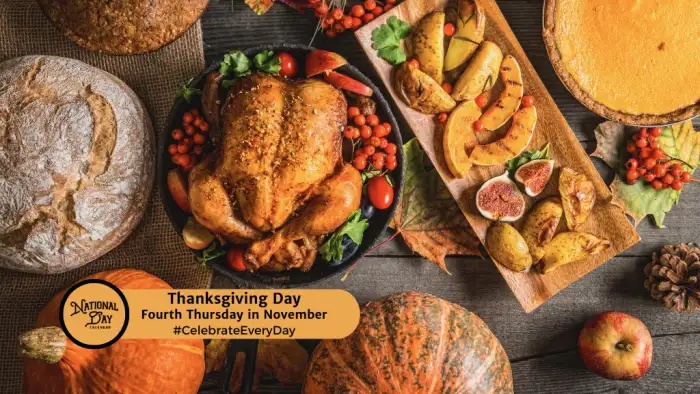


Photo: BCJung, Gozzi Farm Turkeys, CT (11/14/18)

Photo: BCJung, Gozzi Farm Turkeys, CT (11/16/12)

Graphic source: http://thanksgiving-jokes.com/thanksgiving-quotes/

Graphic source: http://comments.funmunch.com/gratitude-quotes-1.html

Graphic source:
http://inspirationboost.com/category/all-quotes/attitude-quotes/page/2
|
Graphic source: https://1.bp.blogspot.com/-NRdqBw_c7wg/ULMhVdHO7cI/AAAAAAAAA9w/u23KcWgwTtw/s1600/World_Anti_Obesity_Day_Logo.jpg |


Graphic source: https://www.firstpost.com/world/un-launches-orange-the-world-campaign-for-action-on-violence-against-women-2520774.html
For more information, see How will YOU Orange the World?

Gratitude is always a good thing because it helps us to keep Life in perspective. We take so many things for granted that we don't appreciate what we have until we don't have it anymore.
I like Research!America's annual "Public Health Thank You Day" because it puts what is my greatest love, Public Health, on the forefront, even if it's just for one day a year.
A re-posting of my 2009 blog entry: Here are some of things we can be thankful for, with many thanks to all the Public Health Professionals, at all levels of practice, who have dedicated their careers to protecting the Public's Health in a variety of ways...


Video source: https://twitter.com/Rainmaker1973/status/1728061304466751790
FIBONACCI DAY
Every November 23rd, Fibonacci Day honors Leonardo Bonacci, one of the most influential mathematicians of the Middle Ages. The date corresponds to the first numbers of the Fibonacci sequence - 1 1 2 3.


For more information, see National Prematurity Awareness Month

For more information, see Chronic Obstructive Pulmonary Disease (COPD)

For more information, see Smoking Cessation

For more information, see WHO - World Toilet Day

For more information, see International Men's Day Sparks Conversation About Mental Health

For more information, see Child Abuse Prevention CDC.gov


Graphic source: http://www.cdc.gov/getsmart/week/index.html
USAAW is an annual observance that raises awareness of the threat of antibiotic resistance and the importance of appropriate antibiotic use.

Graphic source: https://s-media-cache-ak0.pinimg.com/236x/62/96/a5/6296a57f960e915c01fe1aa1ff2c5b75.jpg

Graphic source: https://thumbnails-visually.netdna-ssl.com/lung-cancer-causes_52e22a513e024_w1500.jpg

Graphic source: https://healthsaveblog.com/wp-content/uploads/2016/07/Early-symptoms-of-Lung-Cancer.jpg

Graphic source: http://www.lung-cancer.com/images/lungcancerfacts.jpg
For more information see Lung Cancer Awareness

For more information, see World Day of Remembrance


Graphic source: https://www.huffpost.com/entry/diabetes-influenza-a-dangerous-combination_b_5a0909dde4b0cc46c52e6bde

Graphic source: https://www.cdc.gov/diabetes/pdfs/data/statistics/national-diabetes-statistics-report.pdf

Graphic source: FDA


Graphic source: https://www.cdc.gov/diabetes/pdfs/data/statistics/national-diabetes-statistics-report.pdf

Graphic source: http://lokmankarki.com/wp-content/uploads/2015/11/wpd072.jpg

Graphic source:
http://amediaagency.com/app/uploads/2015/11/Poster.png

Graphic source: https://nationaldaycalendar.com/november-11-2019-veterans-day-national-sundae-day/

Graphic source: http://www.appsforpcplanet.com/wp-content/uploads/2016/11/veterans-day-main.jpg


Graphic source: https://www.cdc.gov/diabetes/library/reports/reportcard/national-state-diabetes-trends.html

Graphic source: https://www.cdc.gov/diabetes/library/reports/reportcard/national-state-diabetes-trends.html

Graphic source: https://www.cdc.gov/diabetes/pdfs/data/statistics/national-diabetes-statistics-report.pdf


Graphic source: https://www.cdc.gov/diabetes/library/reports/reportcard/prediabetes.html

Graphic source: https://www.cdc.gov/diabetes/pdfs/data/statistics/national-diabetes-statistics-report.pdf

Graphic source: http://www.mrchouston.com/wp-content/uploads
/2014/11/National-Diabetes-Month.jpg

Graphic source: http://blog.healthalliance.org/wp-content/uploads/2015/11/Diabetes-Infographic1.jpg
For more information, see Diabetes Resources on the Internet


Graphic source: https://sleepcuresolutions.com/blog/sleep-deprived-driving-is-like-driving-under-the-influence-of-alcohol/
 Graphic source: https://www.10tv.com/article/nhtsa-looks-stop-drowsy-driving-crashes

For more info, see Thinking Forward: Grow Your Retirement Savings


Graphic source: http://www.alsberry.org/wp-content/uploads/2014/09/vote2.jpg

Graphic source: http://www.cnn.com/2016/11/08/politics/susan-b-anthony-gravesite-voting-stickers-irpt/


Graphic source: https://www.cdc.gov/onehealth/one-health-day.html
November 3, 2025, marks the 13th annual One Health Day, a global campaign to bring attention to the need for a One Health approach to public health. One Health recognizes the connection between human health, animal health, and our environment. (CDC.gov)
For more information, see One Health Day

For more information, see Drowsy Driving Prevention Week

Graphic source: Brian Shields, WFTV @BrianShieldsWFTV


Graphic source: https://mgtvwjtv.files.wordpress.com/2016/11/daylight-saving-time.jpg

Graphic source: http://files.ctctcdn.com/9171773f001/1a589a72-dbab-4739-bec2-4ae16f3c6670.gif

Graphic source:http://www.zingerbug.com/Comments/glitter_graphics/fall_back_daylight_savings_time_clock_with_moving_hands.gif


Graphic source: https://finance.yahoo.com/video/ckm-heart-syndrome-linked-obesity-212610950.html


Graphic source:
https://twitter.com/Cmdr_Hadfield/status/1587064989898002435


Graphic source: https://www.nasa.gov/content/goddard/sdo-jack-o-lantern-sun/

Graphic source: https://www.iizcat.com/post/4117/31-cats-who-are-ready-for-fall

Graphic source: https://www.iizcat.com/post/4117/31-cats-who-are-ready-for-fall

Graphic source: https://www.iizcat.com/post/4117/31-cats-who-are-ready-for-fall

Graphic source: https://publichealthcollaborative.org/wp-content/uploads/2021/10/PHCC_2021_Halloween_Safety-Tips-Kids-Activity.pdf

Graphic source: https://publichealthcollaborative.org/wp-content/uploads/2021/10/PHCC_2021_Halloween_Safety-Tips-Kids-Activity.pdf


Graphic source: https://nationaldaycalendar.com/october-29-2018-national-cat-day-world-stroke-day-national-hermit-day-national-oatmeal-day-2/

Graphic source: https://nationaldaycalendar.com/2018/10/28/october-29-2018-national-cat-day-world-stroke-day-national-hermit-day-national-oatmeal-day/

Graphic source: https://www.shutterfly.com/ideas/national-cat-day/


Fructose


Graphic source: http://nutrition-alert.com/wp-content/uploads/2016/01/SPOTASTROKE-1024x511.png


Graphic source: https://www.wcrf.org/dietandcancer/interactive-cancer-risk-matrix


RED RIBBON WEEK , which is celebrated annually October 23 - 31, is the nation's oldest and largest drug prevention awareness program. Celebrate Red Ribbon Week in your community or your child's school, and raise awareness of living a drug free life. Take the opportunity to talk to your kids about drugs.

More than 50 long-term effects of COVID-19: a systematic review and meta-analysis 8/2021

For more information, see About SUID (sudden unexpected infant deaths) and SIDS

"I can teach anything, but I chose Health, because without Health you cannot enjoy Life." (Betty C. Jung)


Graphic source: http://professionals.site.apic.org/protect-your-patients/break-the-chain-of-infection/

Wear It Pink 2025 an annual event to wear pink clothing or accessories to show their support for breast cancer awareness & research. This vibrant and positive campaign aims to raise awareness about breast cancer, encourage early detection, & raise funds for breast cancer research & support services.
Annual Mammos starting at 40, till you die...

Graphic source: https://i0.wp.com/nationaldaycalendar.com/wp-content/uploads/2014/06/National-Mammography-Day-Third-Friday-in-October-1-e1474648588227.jpg

Global Cat Day on October 16th recognizes the need to adopt and foster cats.


Graphic source:https://www.mazzonicenter.org/sites/default/files/infographics-nlaad-2-latinos-hiv-msm.jpg

Graphic source: https://www.cdc.gov/hiv/library/awareness/nlaad.html

Graphic source: https://www.cdc.gov/hiv/library/awareness/nlaad.html

Graphic source: https://www.cdc.gov/hiv/library/awareness/nlaad.html

Graphic source: NLAAD
For more information, see National Latinx AIDS Awareness Day


For more information, see Breast Cancer
Breast Cancer - Patient Version National Cancer Institute
Breast Cancer - Health Professional Version National Cancer Institute


For more information, see Learn More About ADHD and ADHD
Attention-Deficit/Hyperactivity Disorder: What You Need to Know NIH.gov

For more information, see Obesity Resources on the Internet

Types of Mental Illness
healthdirecthttps://www.healthdirect.gov.au Types-of-mental-illness


Graphic source: https://twitter.com/bettycjung/status/1455658159184519180

Graphic source: https://www.cdc.gov/phpr/infographics/healthliteracy.htm

Graphic source:
https://image.slidesharecdn.com/hilcurriculumfinal2008longversion-091023150355-phpapp01/95/health-information-literacy-12-728.jpg?cb=1256310280
Populations with Below Basic Health Literacy

Graphic source: http://www.cdc.gov/healthliteracy/findtraining/onlinecourse.html
Below Basic Level Definition: Adults at the below basic level have only the most elementary literacy skills. These skills range from being non-literate in English to being able to locate easily identifiable information in short, commonplace prose text. An adult at the below basic literacy level might be able to locate and circle the date of a medical appointment on a hospital appointment slip. (Source: http://www.cdc.gov/healthliteracy/findtraining/onlinecourse.html)


Graphic source: http://i2.wp.com/img1.dzmind.com/images/mental-illness-awareness-week.png

Graphic source: https://az616578.vo.msecnd.net/files/2016/05/13/6359870722615541791545011302_odyssey.jpg


Graphic source; https://staysafeonline.org/cybersecurity-awareness-month/
For more information, see National Cybersecurity Awareness Month 2021
See National Cyber Security Awareness Month - Cyber Security is Everyone's Responsibility for what you can do to remain secure in an increasingly connected world.

Graphic source: https://www.tonasgraphics.com/wordpress/wp-content/uploads/2016/10/Bully-Prevention.jpg

For more information, see Bullying

For more information, see National Protect Your Hearing Month and Hearing

Graphic source: USA.gov 10/9/2015 E-mail

Graphic source: https://naplesshelter.org/wp-content/uploads/2016/09/dvam-oct2016-7.png

Graphic source: https://www.cdc.gov/violenceprevention/nisvs/infographic.html
For more information, see Domestic Violence Resources

Graphic source: http://who.int/mediacentre/news/releases/2016/discrimination-ageing-youth/en/

Graphic source: http://patienttalk.org/wp-content/uploads/2016/09/International-Day-of-Older-Persons.jpg

Graphic source: https://1.bp.blogspot.com/-v3Ka6tPgD7E/UkmA9Go6nkI/AAAAAAAAT08/nYoJsHDRJrc/s1600/AgeingPopulation-1024x835.png

Graphic source: http://www.who.int/ageing/media/infographics/en/


For more information, see Heart Disease and Heart Disease 2


Graphic source: https://www.cdc.gov/hiv/group/msm/index.html

Graphic source: https://www.cdc.gov/hiv/group/msm/index.html

Graphic source: https://www.cdc.gov/hiv/group/msm/index.html
New HIV Diagnoses in the U.S. and Dependent Areas for the Most-Affected Subpopulations, 2017

Graphic source: Source: CDC, HIV in the United States and Dependent Areas, Jan. 2019;
https://www.hiv.gov/hiv-basics/overview/data-and-trends/statistics
HIV Diagnoses in the U.S. and Dependent Areas, 2012-2016

Graphic source: CDC, HIV in the United States and Dependent Areas, Jan. 2019; https://www.hiv.gov/hiv-basics/overview/data-and-trends/statistics

Graphic source: https://www.cdc.gov/hiv/data-research/facts-stats/gay-bisexual-men.html?CDC_AAref_Val=https://www.cdc.gov/hiv/group/msm/index.html
For more information, see HIV Among Gay and Bisexual Men CDC.gov

Graphic source: http://www.pewresearch.org/fact-tank/2016/12/28/health-issues-topped-the-list-of-scientific-studies-reaching-wide-audiences-in-2016/ |

Increasing Mortality Rates in the US, but Not From COVID-19 August 29, 2024


Graphic source: https://www.cdc.gov/steadi/images/graphics/falls_startling_stats-800x512.jpg

Graphic source: http://images.ccohs.ca/products/infographics/lightbox/slips_trips_falls.jpg

Meow! (Listen up!) Fall is here! Break out the sweater! How can you guess? I like the green one the best! Meow. (Good night.) (Source: Buzzfeed Cats)

Graphic source: https://www.iizcat.com/post/4117/31-cats-who-are-ready-for-fall

Graphic source: http://earthsky.org/astronomy-essentials/everything-you-need-to-know-september-equinox
For more information, see All you need to know: September equinox


For more information see Child Passenger Safety
July 22, 2024, was the hottest day on record, according to a NASA analysis of global daily temperature data. July 21 and 23 of this year also exceeded the previous daily record, set in July 2023.

Graphic source: https://www.nasa.gov/earth/nasa-data-shows-july-22-was-earths-hottest-day-on-record/
Global daily surface air temperature from January 1940 to July 2023, plotted as time series for each year. 2023 and 2016 are shown with thick lines shaded in bright red and dark red, respectively.World Meteorological Organization

Graphic source: https://www.nbcnews.com/science/environment/july-hottest-month-record-scientist-rcna96475

Graphic source: https://www.scientificamerican.com/article/july-2023-is-hottest-month-ever-recorded-on-earth/


Graphic source: https://www.epa.gov/sites/production/files/2018-05/documents/septicsmart_infographic_052318.pdf
This annual event focuses on educating homeowners and communities on the proper care and maintenance of their septic systems.


For more information, see Think Fungus: Fungal Disease Awareness Week


Source: https://cosmosmagazine.com/space/cassini-s-final-saturn-plunge-approaches

Graphic source: https://cosmosmagazine.com/space/cassini-s-final-saturn-plunge-approaches

Child and Adolescent Immunization Schedule by Age (Addendum updated August 7, 2025)
Recommended Child and Adolescent Immunization Schedule for Ages 18 Years or Younger 8/19/2025
Recommendations for Ages 18 Years or Younger, United States, 2025

Graphic source: https://www.cdc.gov/vaccines/parents/downloads/parent-ver-sch-0-6yrs.pdf

Graphic source: https://www.cdc.gov/vaccines/parents/downloads/parent-ver-sch-0-6yrs.pdf


Graphic source: NBC News

Graphic source:
https://nationaldaycalendar.com/september-11-2019-patriot-day-and-national-day-of-service-and-remembrance-national-make-your-bed-day-national-hot-cross-bun-day/

Graphic source: USA.gov

Graphic source: http://www.serve.gov/?q=site-page/september-11th-national-day-service-and-remembrance

Graphic source: https://nationaldaycalendar.com/2017/09/10/september-11-2017-patriot-day-and-national-day-of-service-and-remembrance-day-national-bossemployee-exchange-day-national-hot-cross-bun-day-national-make-your-bed-day/


Let us never forget all the innocent lives that were lost on that fateful day, and once again thank all the brave civil servants who died in the line duty. Many thanks to Suzanvitti.org for these wonderful graphics.

For more information, see International Fetal Alcohol Spectrum Disorders Awareness Day NIH.gov


Graphic source: https://i.pinimg.com/originals/2b/8b/97/2b8b972ff2d784c17fac11eba2fa4ddd.jpg
For more information, see FDA.gov's Menopause Page and Women Life Cycles


Graphic source: http://www.suicidology.org/resources/infographics/diagnosable-mental-disorder

Graphic source: https://twitter.com/TWLOHA/status/1038783782185304064

For more information, see Suicide Prevention Resources


Graphic source: http://www.smiles-for-kids.com/blog/59

Graphic source:
http://www.arhomevisiting.org/Blog/sarah_infographic.jpg


Graphic source: https://www.noaa.gov/news/june-2022-was-earths-6th-warmest-on-record

Map source: https://www.noaa.gov/news/june-2021-was-hottest-june-on-record-for-us
June 2022 was Earth's 6th-warmest on record. Antarctic sea ice shrank to a record low for the month


Graphic source: https://www.cdc.gov/foodsafety/education-month.html |
For more information, see Food Safety Education Month
Nutrition Resources on the Internet


Graphic source: https://www.samhsa.gov/newsroom/observances/suicide-prevention-month

Graphic source: https://www.samhsa.gov/newsroom/observances/suicide-prevention-month
For more information, see Suicide Prevention Month

For more information, see Gynecologic Cancers

Graphic source:http://www.ci.south-pasadena.ca.us/index.aspx?page=115


Get Toolkit


Graphic source: https://www.statista.com/chart/18744/the-number-of-drug-overdose-deaths-in-the-us/

Graphic source: https://www.statista.com/chart/35050/overdose-deaths-involving-different-drugs/?lid=0u8orvay725g

Graphic source: https://www.justthinktwice.gov/when-your-friend-overdoses-drugs

Graphic source: http://interfaith-works.org/wp-content/uploads/InternationalOverdoseAwarenessDay-Aug31-2016-hpSlider.png

Graphic source: https://www.overdoseday.com/


Graphic source: https://borderlessnewsandviews.com/2013/08/26/womens-equality-day-the-19th-amendment-and-the-right-to-vote/
For more information, Women's Equality Day: The 19th Amendment and the right to vote
On Aug. 26, 1920, the 19th Amendment to the U.S. Constitution, which guarantees American women's right to vote, was certified by Secretary of State Bainbridge Colby. Ratification and certification of this amendment meant that United States citizen could not be denied the right to vote on the basis of gender. This amendment was a long time in the making; it was first introduced in 1878 by Susan B. Anthony and Elizabeth Cady Stanton but it took 41 years until Congress submitted the amendment to the states for ratification.


Graphic Source: https://www.funimada.com/assets/images/cards/big/25th-birthday-15.gif |
It is hard to believe that it has been 26 years since I published the first webpages that turned into this Web site. Many thanks to the millions of visitors who contributed millions of hits during the past 26 years, and for all the nice comments along the way. I will continue to strive to make this Web site a worthwhile place to spend your time and find credible public health and health information. Thank you so much!
 |


For more information about coming eclipses, see Did you miss yesterday's total solar eclipse? Here's your next chance


Graphic created from: http://gatehouseprojects.com/eclipse/Solar-Eclipse/site/thetimesnews.com

Graphic source: http://earthsky.org/tonight/total-solar-eclipse-on-august-21
See the tiny black dot crossing the United States in this this animation of the August 21 solar eclipse? Only here that you can see a total eclipse of the sun. But everyplace within the much larger gray circle will see a partial eclipse

Graphic source: http://abcnews.go.com/US/total-solar-eclipse-2017-upcoming-celestial-event/story?id=48859509

Map source: http://www.today.com/health/solar-eclipse-eye-safety-how-protect-your-vision-t114206
A record number of Americans watched the 2017 solar eclipse -- and sought science afterward 8/2018


Graphic source:http://mediad.publicbroadcasting.net/p/kvcr/files/201707/mosquito-borne-disease-hero1.png

Graphic source: http://clinical-laboratory.blogspot.com/2016/08/mosquito-borne-diseases.html
For more information, see Mosquito Bites: Everyone is at Risk! @CDC_NCEZID

Graphic source: https://www.samhsa.gov/data/sites/default/files/reports/rpt56287/2024-nsduh-annual-national-report.pdf


Graphic source: http://www.fao.org/un-expo/en/un-days/world-humanitarian-day.html
For more information, see WHO's World Humanitarian Day
FAO's World Humanitarian Day


Graphic source: https://www.cdc.gov/mmwr/volumes/67/wr/mm6732a2.htm
For more information, see Contact Lens Week

Graphic : https://www.cdc.gov/drugoverdose/opioids/fentanyl.html

Graphic source: https://www.samhsa.gov/data/sites/default/files/reports/rpt56287/2024-nsduh-annual-national-report.pdf


Graphic source: http://www.marketingcharts.com/traditional/these-financial-stats-show-why-brands-shouldnt-focus-too-much-on-millennials-75298/attachment/epsilon-financial-stats-us-adults-by-generation-mar2017/


The map shows the difference between the sea surface temperature on August 11, 2024, and the 30-year climatological average for that day. Data is preliminary.
Source: NOAA, Daily Optimum Interpolation Sea Surface Temperature
Credit: Daniel Wood/NPR

Ocean heat content (OHC) is a measure of the amount of heat present in ocean water. It is measured in kilajoules per cm. The data above show the OHC for the area of the Atlantic Ocean where the majority of major Atlantic Hurricanes form, seen in the map above. Data accessed on Aug. 2, 2024 Source: Brian McNoldy, University of Miami, Rosenstiel School of Marine, Atmospheric, and Earth Science Credit: Daniel Wood/NPR


Graphic source: https://jamanetwork.com/journals/jama/fullarticle/2822207?guestAccessKey=d77e381f-2d53-417d-8bc9-d2ca2a11a709

Graphic source: https://jamanetwork.com/journals/jama/fullarticle/2822207?guestAccessKey=d77e381f-2d53-417d-8bc9-d2ca2a11a709
Leading Causes of Death in the US, 2019-2023 8/8/2024 JAMANetwork


Graphic source; Facebook


Graphic source: https://pandemicactionnetwork.org/press-release/world-mask-week-aims-to-inspire-global-movement-to-wear-face-coverings-in-public-to-help-stem-exponential-spread-of-covid19/
For more info: World Mask Week

Global, regional, and national burden of 12 mental disorders in 204 countries and territories


Graphic source: https://www.cdc.gov/mmwr/volumes/72/wr/mm7218a3.htm
Provisional Mortality Data - United States, 2022 5/2023 MMWR

Graphic source: https://www.cdc.gov/mmwr/volumes/71/wr/mm7117e1.htm

Graphic source: https://www.cdc.gov/mmwr/volumes/70/wr/mm7014e1.htm

Graphic source: https://jamanetwork.com/journals/jama/fullarticle/2778234

Graphic source: https://www.cdc.gov/mmwr/volumes/70/wr/mm7014e1.htm


Graphic source: http://www.chathampublichealth.com/health-information/august-is-national-immunization-awareness-month/
For immunization information, see Immunization Schedules CDC

For more information, see Lung Cancer and Smoking

Graphic source: https://www.latimes.com/entertainment-arts/business/story/2023-05-09/mtv-news-mainstay-of-90s-shuts-down-rip

Temperature 1880 - July 2023
Video source: https://twitter.com/NASA/status/1691106509319806977


Graphic source: https://twitter.com/ScottDuncanWX/status/1688961122076962841

Graphic source: https://twitter.com/CopernicusEU/status/1685231118969106432


Graphic source: https://www.cdc.gov/Features/WorldHepatitisDay/index.html

Graphic source: http://www.who.int/campaigns/hepatitis-day/2016/messages/en/ |

Graphic source: http://www.who.int/campaigns/hepatitis-day/2016/messages/en/ |


August 1st marks this year's Earth Overshoot Day, according to the latest National Footprint and Biocapacity Accounts ...
Earth Overshoot Day marks the date when humanity's demand for ecological resources and services in a given year exceeds what Earth can regenerate in that year. In 2022, Earth Overshoot Day lands on July 28.


Graphic: https://www.nasa.gov/feature/nasa-releases-logo-to-mark-apollos-50th-anniversary

Graphic source: https://www.nasa.gov/feature/the-us-postal-service-is-issuing-first-moon-landing-forever-stamps

Graphic Source: http://justasmalltowngirlinabigcity.blogspot.com/
2015_07_01_archive.html

Graphic Source: http://nasa-appolo-11.blogspot.com/


Graphic source: https://storify.com/APHA/diabetes-month >

Graphic source: https://storify.com/APHA/diabetes-month


Graphic source: http://www.clark.com/worst-resume-lies |

Graphic source: http://www.clark.com/worst-resume-lies |

For more information, see Minority Mental Health Awareness Month - July


World Population Day: July 11, 2024 US Census.gov


![]()
Graphic source: https://www.cdc.gov/nceh/tracking/BetterInfoBetterHealth.htm
CDC's National Environmental Public Health Tracking Program is hosting the 8th annual Tracking Awareness Week from July 17-21, 2023. CDC, state and local health departments, partners, researchers, and people interested in environmental health are coming together to highlight important nationwide environmental health issues as well as recognize the work of the Tracking Program.
The theme of this year's Tracking Awareness Week is Powered by Tracking. This theme will highlight unique data and tools on the Tracking Network that lead to public health action. Tracking is more than data! This theme will also highlight the network of people and partners that power the Tracking Network, and their contributions to creating healthier communities.


Download Cannabis Prevention Graphics From 'Just Say Know' Campaign
Source: https://twitter.com/NIMHgov/status/1410944251223937025


Graphic source: https://giphy.com/gifs/26tOZ42Mg6pbTUPHW/download


Graphic source: https://www.census.gov/library/visualizations/2021/comm/fourth-of-july.html

Graphic source: WP FactChecker


Graphic source: http://www.texasfred.net/wp-content/uploads/2015/06/Happy-Birthday-America-600x407.jpg

Graphic source: http://www.usa4thofjuly.com/happy-birthday-america-pictures.html/happy-birthday-america-pictures-2

Graphic source: http://finkorswim.com/wp-content/uploads/2011/07/statue.jpg

Graphic source: http://www.popsci.com/fireworks-bring-exhileration-joyand-air-pollution


A day to celebrate our togetherness.
If there is anything we've learned over the past year it is that we are unquestionably connected. There are millions of people across the globe who are taking action to prioritize the health and well-being of the entire global Human Family. #GlobalInterdependenceDay is a day to acknowledge and celebrate our togetherness. Together, we can elevate and amplify the actions of those trying to create a better tomorrow.

Graphic source: https://onsafety.cpsc.gov/blog/2015/06/26/dont-let-fun-with-fireworks-turn-tragic/

Graphic source: https://safety.smart911.com/top-5-fireworks-safety-tips/


Graphic Source:
https://en.wikipedia.org/wiki/Solar_eclipse_of_July_2,_2019

Graphic source: https://www.express.co.uk/news/science/1146535/Eclipse-2019-totality-how-long-solar-eclipse-last-where-is-path-of-totality
Solar eclipse 2019: A total eclipse of the Sun will occur on July 2, 2019 (Image: GETTY)

Graphic source: https://www.express.co.uk/news/science/1146632/Solar-eclipse-2019-when-is-next-solar-eclipse-UK-next-eclipse-date
Solar eclipse 2019: The eclipse happens when the Moon blots out the Sun in the sky (Image: GETTY)

Graphic source: https://www.express.co.uk/news/science/1146632/Solar-eclipse-2019-when-is-next-solar-eclipse-UK-next-eclipse-date
Surprise, surprise - We have a measles epidemic in the U.S. Well, it's not such a big surprise when immunization rates among U.S. children in certain parts of the country (like in Texas's Mennonite community) have not been getting vaccinated.


Graphic source: https://www.cdc.gov/measles/data-research/index.html

Graphic source: https://www.cdc.gov/measles/data-research/index.html
We are still concerned that H5N1 can be the next pandemic. A year ago, experts were saying we were 4 changes away from human to human transmission, which would mark the start of a pandemic, and now experts are saying we are one change away. Just hoping we will not see the change, but that is wishful thinking. More and more animals are becoming infected, which means there's more H5N1 out in the wild that we will probably not be able to control.
Aside from the continual growth of cattle herds being infected, the latest noticeable casualties are cats. Yes, cats that get infected almost always die. For now, they are dying from eating raw meat contaminated with H5N1. Reporting of H5N1 has been mostly minimal. CDC does some reporting (but its workforce has been decimated by Trump), and more wastewater surveillance is being used to detect the spread of H5N1 as well as COVID-19. I still keep up with my weekly statistical updates for COVID-19 and H5N1 on Bluesky. I have 3,988 followers. And, spreading the word on current federal government changes on LinkedIn has been time-consuming but my postings have traction, so it's worth it.


Graphic source: https://www.aphis.usda.gov/livestock-poultry-disease/avian/avian-influenza/hpai-detections/hpai-confirmed-cases-livestock
As of July 1, 2024, infectious disease experts are becoming very concerned with the unabated spread of #H5N1 (Avian Flu) among cattle. Reports have started since March of 2024, and since then, many cows have become infected, and has affected the commercial milk supply. mRNA viral fragments have been found in the milk supply, but researchers assured the public that it's safe, although more current research is finding that pasteurization is effective, although the amount of virus can impact the effectiveness of pasteurization in killing H5N1.
There is not enough epidemiological statistics to characterize this outbreak because dairy farm owners have not been cooperative with federal and local authorities with investigating what's going on. Economics may be a key factor in the lack of cooperation. Obviously, Public Health in not top priority in this situation. Too bad. Maybe when people start dying in hugh numbers then action will take place.
Basic statistics like the percentage of farms affected is unknown, the total number of cows affected is unknown, the total number of dairy workers that have been tested is unknown. Only 45 people have been tested, but who are they? Without some basic statistics of who is infected, how are we to know if human-to-human transmission is occurring, or not? Nobody knows.
Given that humans have zero immunity against H5N1, a pandemic would be devastating. And, the way it is being handled now, we should prepare for a pandemic. There is talk of vaccine development, but action may be needed real soon than just a lot of talk.
The CDC finally released on June 20, 2024 Highly Pathogenic Avian Influenza A(H5N1) Virus in Animals: Interim Recommendations for Prevention, Monitoring, and Public Health Investigations
As of June 20, 2024, this is what the CDC says it know about the spread of #H5N1 among cattle.

And, this what they have come up with, in terms of transmission..

As of July 1, 2025, we are still in pandemic mode. But, there is no official word about where we are. And, we do not have any control over its spread. People are still dying from it. And, right now the big concern is over how accessible COVID-19 shots will be available. Robert F. Kennedy Jr. fired everyone on the ACIP and put 8 new people who are mostly anti-vax and it's unsure what they will do vaccine access.
On June 27, 2025, WHO released its latest report about the origins of SARS-CoV-2. After 4 years of investigations, nobody knows how the pandemic started.
Large gaps in data provided by China, as well as a lack of access to key United States and German intelligence reports, have confounded investigation of the lab leak hypothesis, the 27-member report of international experts concluded.
"Much of the information needed to assess this hypothesis has not been made available to WHO and SAGO, despite repeated request to the government of China, and therefore this hypothesis could not be investigated or excluded,” said Dr Marietjie Venter, SAGO chair and Distinguished Professor at the University of the Witwatersrand, South Africa.
"SAGO is not currently able to conclude exactly when, where, and how SARS-CoV2 first entered the human population,” she explained, adding that “the closest known precursor strains were identified in bats in China in 2013 and in Laos in 2020."
"These strains are too distantly related to SARS-CoV2 to be the direct source of the COVID-19 pandemic,” Van Kerkhove said. “The Huanan seafood market in Wuhan, China, played a significant role in the early transmission and amplification of the virus, with 60% of early cases in December 2019 that could be traced to the market or [people who] lived in close proximity to the market with a risk of exposure to visitors or animal products from the market. No evidence exists of widespread human or animal cases prior to December, 2019, anywhere."
And at the same time, there are in fact two SARS-CoV2 lineages, which were identified in infected humans at the market. This suggests that there had already been prior evolution in animals or in humans, rather than a single source, she said.
It is therefore not yet clear if the seafood market was where the virus first spilled over into humans or if it occurred through upstream-infected humans or animals at the market.
As per those questions, China has shared some of this information, “but not everything that we have requested,” Venter said. “China has provided hundreds of viral sequences from individuals with COVID-19 early in the pandemic, but more detailed information [is needed] on animals sold at markets in Wuhan, and information on work done and biosafety conditions at laboratories in Wuhan.
Source: https://healthpolicy-watch.news/breaking-animal-source-most-likely-origin-of-sars-cov2-but-findings-inconclusive-says-who-expert-group/
Ever since January 20, 2025, with the start of Trump's second term, everything is in constant chaos, from the global economy to the downsizing of the federal Government. Latest WHO Case and Death statistics:


Graphic source: https://data.who.int/dashboards/covid19/cases?n=o

Graphic source: https://data.who.int/dashboards/covid19/cases?n=o

Graphic source: https://data.who.int/dashboards/covid19/cases?n=o
The virus continues to mutate. The latest variant generating a lot of interest now is N.B. 1.8.1

As of July 1, 2024, we are still in pandemic mode. That's because there has been no official word from any entity - internationally or nationally that pronounced that the COVID-19 pandemic is over. This has not prevented the possibility that an H5N1 pandemic may not be too far off as the spread of this virus has continued, unabated among cattle and other farm animals and wild birds migrating all over the place. The only hint that the pandemic is still ongoing is this June 24, 2024 Twitter/X Posting from Maria Van Kerkhove:

COVID-19 data sources are abyssmal at this point. There are no more COVID-19 hospitalization data, since hospitals are no longer required to report such hospitalizations to DHHS, as of May 1, 2024. It’s now voluntary. Only 38% of hospitals continue to do so (vs. 90+% during the emergency).
How many people are being tested for COVID-19? No one really knows, as home testing is encouraged without the need for people to report the results - positive, negative, etc. They probably could gauge how many are sick with COVID-19 by looking at the number of Paxlovid prescriptions filled, though pharmacies don't have to report this. And, they probably could get an idea of how many people are possibly sick by the number of home tests sold.
COVID-19 Cases and Deaths
The only entity that is still reporting is the World Health Organization. However, if they are aggregating from reporting countries, most likely the statistics are ALL undercounts.
The Global Burden of Death puts COVID-19 as #3.

This is the most recent weekly report from WHO:

Graphic source:https://data.who.int/dashboards/covid19/cases?n=c

Graphic source: https://data.who.int/dashboards/covid19/deaths?n=c

Graphic source: https://data.who.int/dashboards/covid19/cases?n=c

Graphic source: https://data.who.int/dashboards/covid19/deaths?n=c
When looking at these statistics, you can see, over the most recent 28 days, new COVID-19 cases are still occurring, while deaths have dropped. The death rate for a 28-day period is 1.24%. Cumulatively, the death rate is .90%.
The only time I've seen them use health care utilization data was to predict the spread of COVID-19, based on Emergency Room visits.

Wastewater surveillance has taken on a more visible role in providing disease data about how communities are doing. In recent months, the WastewaterSCAN Dashboard has been posted offering data about the spread of infectious diseases, based on wastewater. The CDC also maintains a webpage covering wastewater surveillance. The data presentation is comparable.
The most recent map visualization about where COVID-19 is found continue to show that COVID-19 infections are widespread.


Graphic source: https://www.cdc.gov/nwss/rv/COVID19-currentlevels.html
COVID-19 continues to mutate


Graphic source: https://publichealth.jhu.edu/2022/omicrons-many-subvariants Credit: Daniele Focosi, As of 11/4/2022
Fortunately, the genomic sequencing of subvariants have enabled decisions regarding vaccine development. Though not official, the more vulnerable people will probably require twice-a-year COVID-19 vaccines, given about 6 months apart to protect against variants. By the way, new subvariants have shown up since this Focosi chart came out in 11/2022.
Interest in COVID-19 and vaccines
For most, people have moved on. They shouldn't. Here is a static capture of a Google Trends analysis of searches for COVID-19 information and Covid-19 vaccine information, between June 30, 2019 - June 2, 2024
Search: https://trends.google.com/trends/explore?date=today%205-y&geo=US&q=COVID-19,%2Fg%2F11j8_9sv06&hl=en
As of July 1, 2023, we are still in pandemic mode, even though the World Health Organization has declared an end to the COVID-19 public health emergency on May 5, 2023 ( WHO chief declares end to COVID-19 as a global health emergency "Last week, COVID-19 claimed a life every three minutes, and that's just the deaths we know about", said Tedros Adhanom Ghebreyesus.
This announcement comes only 1 week after WHO's technical lead, Dr. Maria Van Kerkhove told an audience that COVID-19 was spreading unchecked. No wonder people are so confused.

The U.S. government has declared an end to the pandemic. End of the COVID-19 Public Health Emergency on May 11, 2023. This basically puts the #COVID18Pandemic on the backburner for most people.
All the funding made possible by this emergency declaration for programs to help people deal financially with the pandemic is gone. Millions of people are now in the process of losing Medicaid coverage (healthcare access). And with the passage Biden signs debt limit bill, avoiding U.S. default on June 3, 2023, $30 billion of unspent #COVID19 funding will no longer be used to address COVID-19 issues. How the debt ceiling deal impacts Covid funds.
Nobody has bothered to inform SARS-CoV-2 virus that the pandemic ended. It is still mutating like crazy, and is settling to create an XBB cluster of Omicron.

Graphic source: https://twitter.com/EricTopol/status/1615138288129703937

Graphic source: https://www.bettycjung.net/COVID-19.htm
What most ironic that on June 25th, there is now an F.U.1 variant. So appropriate with how the virus is treating this pandemic.
New Covid-19 variant spreading swiftly, doctors warn

Preventive measures are not being practiced as they should be to protect the Public's health. When NPR.org was asked about when one should be masking, the answer they gave:

Graphic source: https://twitter.com/bettycjung/status/1669866365874839552
By June 7, 2023, indoor air is still a problem, and ventilation is till needed to reduce transmission. Here is a reading from a half-empty mid-town Manhattan restaurant Aranet reading

Perhaps, the most telling of the failure in the practice of preventive measures was when 10% attendees at an April, 2023 CDC meeting of its Epidemic Intelligence Service officers and alumni came down with COVID-19 due to inadequate masking. "About 70 percent of participants who responded to a CDC survey said they did not wear masks at the event." ( Tally of covid-19 cases after CDC conference climbs to 181 )
Data-wise, reliable sources, up to May 2023, like the Johns Hopkins COVID-19 tracking dashboard, are gone. CDC has cut back what is reports to a minimum, relying on only data sources for which entities are to required, which shows how inadequate these sources are for monitoring the progress of pandemic containment. Lost are new cases of COVID-19. How can we possibly know how prevalent it is and the rate of community transmission? A sad state for disease surveillance to be in. We are basically flying blind of the course of the pandemic, and I am not all right with this.
Summary of the impact with the ending of the Public Health Emergency

Graphic source: https://twitter.com/bettycjung/status/1656528887000563715

Graphic source: https://twitter.com/bettycjung/status/1656882701641699328 "
Finally, as for the origins of COVID-19, no patient zero has been identified.

As of July 1, 2022, we are still in pandemic mode, since March 11, 2020, when WHO declared the pandemic. COVID-19 has shown no signs of abating, as it comes in surges. Epidemiologists are trying to determine if there is any seasonality to the surges, although it looks like it is too soon to tell. We are in an Omicron sub-variant surge right now with several BA.2 sub-variants and BA.4 and BA.5 are rising, which may cause a surge in the fall.
July 1, 2022 - How do key COVID-19 metrics compare to previous waves?

Graphic source: https://ourworldindata.org/grapher/us-covid-cases-hospital-icu-deaths?country=~USA
The way I see it, unless new cases consistently drop over time, we are not in control. While fewer people are dying or being hospitalized, this does not mean the virus is dying out. An explanation for fewer deaths and hospitalizations is there are more people vaccinated now than a year ago. However, there is still not enough people who are fully protected to prevent the virus from finding a home in unprotected or unvaccinated people. And, as long as the virus can infect someone, it will replicate and mutate, which is exactly what it is doing quite proficiently.
Although most of the preventive practices have fallen apart because various entities have decided to drop the mandates either through declaring they are no longer necessary, or by default by not enforcing such measures as masking, social distancing, requiring proof of testing negative or proof of vaccinations. According to a June 10, 2022 US News and World Report article, 2/3s of Americans should be wearing masks because of high community spread. (https://www.usnews.com/news/health-news/articles/2022-06-10/cdc-67-of-americans-should-be-wearing-masks-indoors-or-considering-it)
Those who continue to suffer are the millions who are immunocomromised with pre-existing conditions for which there is no cure, thus, leaving these people vulnerable to infection, hospitalization and death. Researchers have found that infected immunocomprised people are ideal for COVID-19 mutations.
Data sources for COVID-19 metrics have fallen apart from entities not consistently reporting on new cases, hospitalizations and deaths. The CDC recommendation to check community spread to determine just how safe it is to go without preventive measures is laughable when the data are incomplete, underreported, or not reported all. No one is sure how many tests are being done as the use of home-testing is not tracked in any consistent manner. The most current map provided shows that only 2.17% of the U.S. has low transmission, yet not everyone is masked or social distancing. People are out socializing in crowded indoor venues.
June 25, 2022

Graphic source: https://covid.cdc.gov/covid-data-tracker/#county-view?list_select_state=all_states&list_select_county=all_counties&data-type=Risk
The emphasis on the use of wastewater surveillance methods is promising, but the data collected are not appropriately analyzed to yield actionable findings. The CDC's Web site (https://covid.cdc.gov/covid-data-tracker/#wastewater-surveillance) provides a map plotting wastewater data sources, a recently added wastewater metric chart and a list of the results from these sources. None really useful for the average citizen to use to determine how bad COVID-19 is spreading in a particular community.
However, CDC selected Biobot Analytics to "Expand National Wastewater Monitoring" in May 2022, and the data presentations on The Biobot Network of Wastewater Treatment Plants have been very useful (https://biobot.io/press-release/u-s-centers-for-disease-control-and-prevention-selects-biobot-analytics-to-expand-national-wastewater-monitoring/), judging by the number of likes my tweets of these data have been, which show how regional analyses can really help communities see if they have high community spread, and if they are worse off than other communities.
June 25, 2022

Source: https://biobot.io/data/
U.S. vaccination rates have been dismal, and how these data are reported can be deceptive. For example, citing statistics for "at least one shot" may yield the highest percentage possible, but is meaningless in terms of assessing the impact of vaccination against COVID-19, as one shot IS NOT PROTECTIVE against COVID-19.
Furthermore, with the rise of numerous subvariants, boosters have become necessary. Although at this point it is not clear how many boosters will be needed, the frequency of boosters, and for whom. Thus, another misnomer that confuses the proper presentation of vaccination rates is referring to the original two-shot series (for PFizer and Moderna) or one shot (Johnson & Johnson) as "Fully vaccinated." Though it may be true, at the time, that the hope would be getting these initial shots would do the trick, it has turned out not to be case. Now, some have referred to the original vaccinations as the primary series, although no entity has bothered to clarify this to the public and the CDC still presents data for the two-series or one-shot J&J as "Fully vaccinated."
As of June 26, 2022, CDC still reports "At least one dose" (78.1%), "Fully Vaccinated" (66.9%), "First Booster Dose" (67.1%), "Second Booster Dose" for Population 50 Years of Age (26.1%), and for Population 65 Years of Age (32.7%). In the end, the percentage of the US population that can be considered fully protected is between 26.1% and 32.7%, or the number of people who actually got all the shots they were supposed to get, once the vaccine doses became available. Given how low the percentage is for the fully protected, vaccinations have been shown to reduce hospitalizations and mortality. One can only wonder how much better things could be if more people get fully vaccinated, and thus become fully protected.
June 24, 2022

Part of the problem for these low rates had to do when the Supreme Court ruled in January 2022 that large companies with many employees cannot mandate the vaccinations of their workers. It basically overstepped as the federal government already has an oversight agency to deal with the health and safety of workers, the Occupational Safety and Health Administration (OSHA). As a result of this decision, ALL people working for large companies were at risk for getting infected in the workplace. Terrible decision that it should not have made. (https://law.stanford.edu/2022/01/20/a-look-at-the-supreme-court-ruling-on-vaccination-mandates/)
The nomenclature imposed by the World Health Organization to identify COVID-19 variants and subvariants have not been useful and confusing. WHO dropping two Greek letters for unexplained reasons (some have alluded to political correctness) made little scientific sense.

Graphic source: https://www.aljazeera.com/news/2022/2/2/omicron-sub-variant-found-in-57-countries-says-who
The use of Greek letters to name variants has not been specific enough to deal with the numerous subvariants that have emerged with the Omicron variant. Currently, the world has been dealing with a number of subvariants. According to GISAID's genomic sequencing, the number of Omicron subvariants continue to grow, but are all referred to as Omicron even though all have distinguishing characteristics and differ in how transmissible they are and how different groups of people respond differently to the sub-variants.
June 21, 2022

Source: GISAID
We still don't know who Patient Zero is. China has not been cooperative with WHO investigations. The predominately theory is still animal spillover at a wet market, but still no definitive animal has been identified. Unless something definitive comes up, the only "sure" explanation right now is the report that the pandemic started on November 17, 2019 and a 55 year old (no gender given) Hubei resident may be the index case.
The death toll from COVID-19 for the U.S. reached one million in early May 2022, approximately May 5, 2022, or so. The U.S., has the highest number of COVID-19 deaths in the world.
May 5, 2022

Preliminary 2021 statistics show that COVID-19 was either 1st, 2nd or 4th cause of death, depending on age group.

Source: https://www.statnews.com/2022/05/10/the-five-pandemics-driving-1-million-u-s-covid-deaths/
In January 2022, more people age 15 and older died of COVID-19 than cancer.

Source: https://www.healthsystemtracker.org/brief/covid-19-leading-cause-of-death-ranking/
In August 2021, COVID-19 was the leading cause of death in the U.S.

Graphic source: https://www.healthsystemtracker.org/brief/covid-19-continues-to-be-a-leading-cause-of-death-in-the-u-s-in-august-2021/
Last year, 600,000 deaths were reached on June 16, 2021. As of July 1, 2021, Biden's hope for 70% of the population to have at least one shot (even though Pfizer and Moderna require 2 shots for full protected) is being dashed as vaccination has come to almost a standstill in many counties with low vaccination rates.
If you think of March 11, 2020 as the start of the pandemic in the U.S., (when WHO declared COVID-19 a pandemic), it's been 16 months with no end in sight. Vaccinations have been slowing down in recent months in the U.S., and many countries are slow in general vaccinating their citizens. Tokyo is still holding the Olympics even though surveys of Japanese citizens say they don't want it. It all comes down to money. If Japan pulls out now, it will cost the country millions.
As of July 1, 2021, 47.7% of the U.S. population has been fully vaccinated. If you look at only U.S. adults, it's 57%, so still not the proverbial 70% (but may need to be higher, depending on how bad the variants are in transmitting the virus) for herd immunity.
Efforts to get people vaccinated include offering free food and drinks, free trips and a chance to win big playing the lottery. There are reports that people would get the shot if they got paid $100. How avaricious people have become! Like, doing it because it's the right thing to do is no longer in the equation! This goes along with the reports of skepticism over why are people being bribed to get vaccinated? What a crazy world!
Masking continue to be an issue with some, especially after Rochelle Walensky added to the confusion why saying those vaccinated can rip off their masks. Some posit that it has become a social class thing where the rich don't need to wear masks and the working class do. https://www.nytimes.com/2021/07/03/style/are-masks-a-new-signifier-of-social-class.html
I reminded people about the October 2020 White House superspreader event where many were infected for not wearing a mask. (https://www.nbcnews.com/think/opinion/trump-hope-hicks-test-positive-covid-19-doubters-become-possible-ncna1241934; https://www.cnn.com/2020/10/06/politics/white-house-contact-tracing/index.html; https://media11.s-nbcnews.com/i/MSNBC/Components/Video/202010/nn_pal_white_house_contact_tracing_201002_1920x1080.jpg) and, that vaccinations are protecting the vaccinated from getting infected (https://www.abc.net.au/news/2021-06-28/vaccinated-attendees-west-hoxton-birthday-party-avoid-covid-19/100249612)


Graphic source: https://www.cnn.com/2021/07/02/health/us-coronavirus-friday/index.html
July 7, 2021

Graphic source: https://www.nbcnews.com/health/health-news/coronavirus-map-confirmed-cases-2020-n1120686
July 7, 2021

Graphic source: https://www.nbcnews.com/health/health-news/coronavirus-map-confirmed-cases-2020-n1120686
June 16, 2021 - US - 600,000 deaths from COVID-19

Graphic source: https://www.nytimes.com/live/2021/06/16/world/covid-vaccine-coronavirus-mask

Graphic source: https://www.nytimes.com/live/2021/06/16/world/covid-vaccine-coronavirus-mask


The U.S. is not doing well at all. We have the highest number of cases and deaths in the world. During the last five days of June, 2020, there were major spikes in new cases in large states as Arizona, California, Florida, and Texas. July will be critical as to whether or not the country has lost control of the virus.


Graphic source: Freepik |

Graphic source: Veteezy |

Graphic source: http://giphy.com/gifs/2013-happy-new-year-dgAH5jjyrvTa0 |

Graphic source: WishingU-Ahappynewyear.gif |
|
Graphic Source: https://www.funimada.com/assets/images/cards/big/26th-birthday-15.gif |
| It is hard to believe that it has been 25 years since I published the first webpages that turned into this Web site. Many thanks to the millions of visitors who contributed millions of hits during the past 25 years, and for all the nice comments along the way. I will continue to strive to make this Web site a worthwhile place to spend your time and find credible public health and health information. Thank you so much!
|

Graphic source: http://www.healthliteracymonth.org/ |
Be a Health Literacy Hero! I am!
For Health Literacy Month, the Healthliteracymonth.org is accepting stories from any person who or organization that addresses health literacy in their work. There is a listing of those who have submitted their stories. |
| Betty's Home Page | Site Map |
R1,868
Comments, suggestions, dead link reports: 
Copyright 2024-2026 Betty C. Jung
All rights reserved.
