
https://www.bettycjung.net/Blog2012.htm


Blogging since 2000....

|
 |
 |


|

|

Custom Search
|
Custom Search
|


| January - June | July - December |
 <
<
Graphic source: http://blogs.cdc.gov/healthliteracy/
"Inform, educate, and empower people about health issues" is considered one of the 10 essential public health services provided by public health professionals. (Source:http://www.apha.org/programs/ standards/performancestandardsprogram/resexxentialservices.htm) Those who work as health educators know that health messages need to be tailored to the population it was intended for. This requires an understanding of the concept of health literacy.
Healthy People 2020 defines Health Literacy as "the capacity to obtain, process, and understand basic health information and services to make appropriate health decisions." (Source: http://www.cdc.gov/healthliteracy/) This means that public health messages need to be understood by everyone at their level of understanding. So, culturally competent health educators would know to provide information in the language of the community receiving the information (e.g., Spanish language materials for Hispanic communities).
In mid-April, the CDC launched its new Health Literacy: Accurate, Accessible and Actionable Health Information for All Web site that "provides information and tools to improve health literacy and public health. " The site provides health literacy training (for continuing education credits) for any professional providing health information and services; access to the National Action Plan to Improve Health Literacy; a guide to developing an organizational plan for delivering health information and services; how to develop products and services, and much more. A site definitely worth checking out.
Click on the graphic to get to the site. For more information, see Health Literacy and Cultural Competency
 |
The Guide to Privacy and Security of Health Information, is an instructional guide designed to help healthcare practitioners, staff, and other professionals better understand the important role privacy and security play in the use of electronic health records (EHRs) and Meaningful Use. The guide is a comprehensive, and easy-to-understand tool to help providers and professionals integrate privacy and security into their clinical practice and includes sections addressing:
Click on the entry title or the graphic to access the guide. For more information see Health Care Quality Issues |
 Graphic source: http://www.marketingcharts.com/direct/2-in-5-young-consumers-regret-posting-personal-information-online-21932/eurorscg-consumers-privacy-concerns-april2012jpg/ Results from the Euro RSCG Worldwide's This Digital Life Study (7K consumers in 19 countries)and the Badoo survey of 2,000 Americans (3-4/2012).
|
|

Graphic source: http://www.marketingcharts.com/direct/social-media-said-to-present-significant-reputational-risks-22952/altimeter-social-media-biz-risks-august2012png/ Here are some findings from an August 2012 study by Altimeter Group:
|
Remember, once it's on the Internet, it is very hard to remove it, so be careful about what you post. |
We all want to see good health care. But how do we really know what's good health care? Well, the best way to to measure what we're doing? The questions become: How do we measure and what should we measure? The Consumer-Purchaser Disclosure Project has come up with ten criteria for meaningful and usable measures of performance.
For more information, see Research Resources

For resources to deal with violence, see Connecticut Public Health Resources, and Kids Health Resources

|
|
HealthData.gov is the place to go if you are looking for data gathered by federal agencies. It is a revamp of HealthData.gov now known as "Health Data Community" |

Graphic source: http://www.agingstats.gov/agingstatsdotnet/main_site/default.aspx |
Selected highlight from the latest report on the well-being of older Americans include:
Click on the graphic to access the report. For additional information, see Senior Health |

Graphic source: http://www.nytimes.com/interactive/2011/09/13/us/income-poverty-rate-at-1990s-levels.html |
Here are two September 13, 2011 New York Times graphics of US Census data, showing the current median income, and another showing the nation's 2010 poverty rate reaching 15.1 percent, the highest level since 1993.
According to the US Census:
For more information, see Income, Poverty, and Health Insurance Coverage in the United States: 2011 Census.gov 9/2012 and US Federal Government Statistics |

Graphic source:http://www.marketingcharts.com/direct/landline-phone-penetration-dwindles-as-cell-only-households-grow-22577/cdc-us-household-phone-status-h12008-h22011-jul2012png/ According to June 2012's US National Health Information Survey (NHIS)
|
Imagine the impact this would have on telephone-based surveys, as the Behavioral Risk Factor Surveillance System! |

Graphic source: http://www.hschange.org/CONTENT/1260/SP2.htm |
While the source of health information has changed over time, what is the impact of such information on health behavior? According to the Center for Studying Health System Change:
These findings further support the importance of being discriminating about what kinds of health information are found on the Internet. If people are going to use the information they find, then that information should be credible in nature. See Evaluating Web site Quality |

Graphic source: http://www.cdc.gov/mmwr/preview/mmwrhtml/mm6132a9.htm |
In the August 2012 MMWR report, "Use of Health Information Technology* Among Adults Aged =/>18 Years National Health Interview Survey (NHIS), United States, 2009 and 2011," results show:
"Between 2009 and 2011, increases were noted in the proportion of adults aged ≥18 years who used the Internet to fill a prescription (5.9% to 7.1%), schedule an appointment with a health-care provider (2.6% to 4.5%), and communicate with a health-care provider by e-mail (4.6% to 5.5%). The use of online chat groups to learn about health topics also increased (3.3% to 3.7%). The percentage of adults who looked up health information on the Internet did not change significantly between 2009 (45.5%) and 2011 (46.5%), but in both years, looking up health information on the Internet was seven to 14 times as likely to occur as each of the other four activities."
For sure, access to the Internet has become an indispensable means to not only seek health information, but to conduct tasks associated with maintaining one's health. |

Graphic source: http://www.cdc.gov/nchs/data/databriefs/db66.htm According to the July 2011 NCHS Data Brief, "Use of the Internet for Health Information: United States, 2009"
For more information, see Evaluating Online Health Information |

Graphic source:http://www.hschange.org/CONTENT/1260/ |
According to the Center for Studying Health System Change (11/2011):
|

Graphic source:http://www.hschange.org/CONTENT/1260/ |
The Center for Studying Health System Change reported in November, 2011:
|
There is way too many research studies to digest these days. So, how do we separate the chaff from the wheat? George Lundberg, MD, Editor-at-Large, MedPage Today, Editor-at-Large, MedPage Today offers these pointers:
Strategies for preventing stroke:
For more information, see Cerebrovascular Disease

Graphic source: http://medicineworld.org/news/news-archives/1083222147-Aug-18-2009.html |
In a recent 11/4 study of stroke patients, researchers found that many do not see a connection between tobacco and stroke.
|

Photo: BCJung, Gozzi Farm Turkeys, CT (11/16/12) |

Graphic source: http://comments.funmunch.com/gratitude-quotes-1.html | 
Graphic source: http://inspirationboost.com/category/all-quotes/attitude-quotes/page/2 |

Graphic source: http://store.samhsa.gov/product/Mental-Health-United-States-2010/SMA12-4681?WT.ac=EB_20120425_SMA12-4681 |
In March 2012, the Substance Abuse & Mental Health Services Administration (SAMHSA)released "Mental Health, United States, 2010" which covers the nation's mental health system across three themes: people; treatment facility characteristics; and payers and payment mechanisms. Includes state-level data, needs of children and military personnel, and services in non-traditional settings.
To access the report, just click on the graphic.
|

| Gratitude is always a good thing because it helps us to keep Life in perspective. We take so many things for granted that we don't appreciate what we have until we don't have it anymore.
I like Research!America's annual "Public Health Thank You Day" because it puts what is my greatest love, Public Health, on the forefront, even if it's just for one day a year.
Graphic source: http://www.researchamerica.org/ph_thank_you |
A re-posting of my 2009 blog entry: Here are some of things we can be thankful for, with many thanks to all the Public Health Professionals, at all levels of practice, who have dedicated their careers to protecting the Public's Health in a variety of ways...

Graphic source: http://www.cdc.gov/nchs/data/databriefs/db95.htm |
Stroke hospitalization trends are changing. According to the CDC:
For more information, see Cerebrovascular Disease |

Graphic source: http://www.cdc.gov/mmwr/preview/mmwrhtml/mm6129a7.htm |
Stroke hospitalization statistics were released in July by the MMWR. According to the CDC,
For more information, see Cerebrovascular Disease |
Graphic source: http://www.medscape.org/viewarticle/771281_transcript |
|||
According to Medscape's "Sickeningly Sweet: Sugar Consumption and Public Health" Dr. Lustig reports:
|
 I love New York City's campaign about how drinking just one soda a day equals 50 pounds of sugar a year. That's a whole lot of sugar, and it's even worse than that when it's high fructose corn syrup. I also love how this map shows how much exercise you need to work it off. So, are you willing to do the 3 miles to prevent all those excess calories from turning into excess weight? |

Graphic source: http://www.nyc.gov/html/doh/html/pr2011/pr026-11.shtml |

Graphic source: 9/27/2011 Healthy People, Healthy Places Newsletter |
According to the CDC's 9/27/2011 Healthy People, Healthy Places Newsletter's Help Reduce Childhood Obesity: Rethink Your Student's Drink
For more information, see Nutrition Resources |


Graphic source: http://authoring.commonwealthfund.org/sitecore/shell/ Controls/Rich%20Text%20Editor/~/media/ Images/Publications/Fund%20Report/ 2012/Local%20Scorecard/local%20Ex1%20L.gif |
Does where you live affect your access to health services? You bet it does. According to the March 2012 release of Commonwealth.org's "Rising to the Challenge: Results from a Scorecard on Local Health System Performance, 2012"
|
And, it was only one year ago that I posted this for the 2011 "Once in a lifetime October Nor'easter"....
NYC Flooding Before the Blackout
NYC Flood Map

NYC - They don't mind

NYC's Subway Flooding

NYC's Financial District

NASA's Atmospheric Infrared Sounder (AIRS)infrared image of Hurricane Sandy, with Canadian cold air weather front to the west at 2:17 p.m. EDT Oct. 29.

New York City's Gravesend Bay

New York City's World Trade Center Construction Site

Post-tropical Cyclone Sandy, Landfall, 5 miles SW Atlantic City, NJ


10/29/2012 NASA Image

10/29/2012 Satellite Image

10/29/2012 6 PM

10/29/2012 11 AM


Graphic source: http://www.geofffox.com/ |

Graphic source: http://www.boston.com/news/weather/weather_wisdom/2012/08/tropical_storm_isaac_getting_s.html What a travesty of horrible weather! 2011's Hurricane Irene was bad enough, and now this???? If you are interested in tracking weather nightmares, see Latest Weather Updates For information, see Hurricanes and Safety |
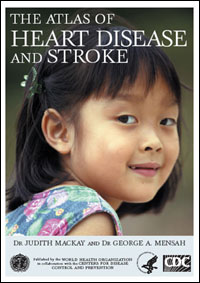
Graphic source: http://www.who.int/cardiovascular_diseases/resources/atlas/en/ |

Graphic source: http://www.worldstrokecampaign.org/2012/Pages/Home.aspx Today is World Stroke Day. Did you know worldwide that 1 in 6 will have a stroke in their lifetime? Stroke is one of the most debilitating diseases around. If a person survives a stroke, they will most likely be left with some disability for the rest of their lives. One of the major risk factors of stroke is high blood pressure. Do you know if you have high blood pressure? Go see your doctor and find out if you are. If you are, it is important to keep it under control, which may require you to take medicine consistently. Good diet practices, like cutting salt, and exercising can all help to reduce the risk for stroke. Click on the graphic to view the World Health Organization & CDC's latest compilation of global heart disease and stroke statistics. A wealth of information!! You can also find this, and other resources at Cerebrovascular Disease (Stroke) and Cardiovascular Disease |

Graphic source: http://www.cdc.gov/nchs/data/databriefs/db71.htm According to the NCHS Data Brief (Number 71, August 2011) "Consumption of Sugar Drinks in the United States, 2005-2008" Americans are drinking way too many calories. "On a given day, there is a wide range of sugar-drink consumption. About 50% of the population consumes no sugar drinks; 25% consumes some sugar drinks but less than 200 kcal (more than one 12-oz can of cola); and 5% consumes at least 567 kcal from sugar drinks on any given day (more than four 12-oz cans of cola)." |
Key findings include:
For more information, see Nutrition Resources and Nutrition Statistics |

Graphic source: http://www.medscape.org/viewarticle/771100_transcript |
According to Medscape's "Review of Clinical Trials on the Relationship Between CVD and Glycemic Control in Diabetes," Dr. Cho notes:
"As all of us know, type 2 diabetes is increasing. Whether you're in Africa, Asia, or North America, the prevalence of diabetes is increasing. In fact, the CDC reports that if you're an African American girl born in United States you have almost a 50% chance of developing diabetes in your lifetime. So type 2 diabetes is truly an epidemic in this country." Citation source: http://www.medscape.org/viewarticle/771100_transcript |

Graphic source: http://www.thesuperherobody.com/weight-loss-resources/fructose-is-not-glucose/ Here is another reason why you should avoid high fructose corn syrup (corn sugar). December 7th, Boston University researchers/Endocrine Society reported:
For more information, see Diabetes |

Graphic source: http://www.medscape.org/viewarticle/771281_transcript According to Medscape's "Sickeningly Sweet: Sugar Consumption and Public Health" Dr. Lustig explains:
|
|

Graphic source: http://apps.nccd.cdc.gov/DDT_STRS2/NationalDiabetesPrevalenceEstimates.aspx?mode=OBS |
According to CDC's Division of Diabetes Translation 4/3/2012 release of
2009 county-level estimates of diagnosed diabetes in the United States, "County-level estimates diabetes and selected risk factors can be used to maximize use of existing resources for diabetes management and prevention efforts, including health policy." Source: CDC 4/3/2012 E-mail: CDC releases 2009 county-level estimates of diagnosed diabetes, obesity, and leisure-time physical inactivity in the United States
Looking at this map, it is evident that the concentration of diagnosed diabetes is found in the southeastern states of the U.S. Perhaps, community interventions for the prevention of diabetes should be concentrated in these states as well. |
 |
Here is a bar showing the racial and ethnic make-up of those with diabetes. The largest group with the highest percentage is Alaska Natives and American Indians, followed by Blacks and then Hispanics.
For more information, see Minority Health and Diabetes |

Graphic source: http://www.medscape.org/viewarticle/754194_transcript |
Here is a great graphic from Medscape's "The Prevalence of Obesity & Diabetes in Different Populations". Typical of chronic diseases, it is a complex mix of risk factors.
While a number of factors can be seen to contribute to the development of type 2 diabetes, it is obesity that creates changes in the body's metabolism that contributes to the the development diabetes. For more information, see Diabetes |

Graphic source: http://www.medscape.org/viewarticle/754194_transcript |
In recent weeks I have posted a variety of obesity statistics. For sure, it is the public health scourge of the 21st century that is the harbinger of type 2 diabetes.
For more information, see Diabetes |

Graphic source: http://www.medscape.org/viewarticle/771281_transcript |
Here is a series of maps that pretty much says it all. Notice how obesity and inactivity are clustered in the southeastern U.S. states where there are high prevalences for type 2 diabetes and cardiovascular. No coincidence. Actually, I presented a similar look at this August 19, 2010!! This is just more data to show that unhealthy eating and lack of exercise are behind the growing diabetes epidemic and why we can't seem to conquer heart disease. |

Graphic source: http://www.drsharma.ca/wp-content/uploads/edmonton-obesity-staging-system-staging-tool.pdf The Edmonton Obesity Staging System (or, Edmonton Obesity Scale or Edmonton Score), first introduced in 2009 by Arya M. Sharma, MD, may grow in importance as the obesity epidemic continues because it can better gauge a person's risk for obesity-related mortality. On August 16th, researchers reported the use of the Edmonton Obesity Scale to predict mortality and bariatric surgery urgency, by applying it to NHANES participants with a BMI of 25 or greater:
|

Graphic source: http://www.drsharma.ca/wp-content/uploads/sharma-edmonton-obesity-staging-system.jpg
For more information, see Obesity Information |

Graphic source: http://meps.ahrq.gov/mepsweb/data_files/publications/st364/stat364.shtml |
Here is another chart from AHRQ's March 2012's STATISTICAL BRIEF #364: Obesity in America: Estimates for the U.S. Civilian Noninstitutionalized Population Age 20 and Older, 2009 looking at comorbidities, by weight categories. Here you can see that carrying excess weight increases the risk for these chronic diseases/conditions: heart disease, diabetes, high cholesterol and joint pain. Joint pain and heart disease show the highest percentage for those who are overweight and obese.
For more information, see Obesity |

Graphic source: http://www.dietandcancerreport.org/cancer_resource_center/er_graphics_display.php?ID=12 |
 According to the WCRF/AICR Second Expert Report, global obesity projections are scary. As compared to other countries that were included in the analysis, 60% of American women will be considered obese by 2015, and that's not too far away. This is followed closely by American men, who seem to be way ahead of all the men in other countries in being classified as obese by 2015. According to the WCRF/AICR Second Expert Report, global obesity projections are scary. As compared to other countries that were included in the analysis, 60% of American women will be considered obese by 2015, and that's not too far away. This is followed closely by American men, who seem to be way ahead of all the men in other countries in being classified as obese by 2015.
For more information, see Obesity Information |

Graphic source: http://www.cdc.gov/obesity/data/adult.html 
Graphic source: http://www.rwjf.org/files/images/pr/figures/top10_bottom10_maps_v2-01rev.jpg |
Here is the most recent map of US adult obesity based on Behaviorial Risk Factor Surveillance System data. Perhaps the saddest thing about this map is the inclusion of the 35% and greater category even when no state at this point qualifies.
Sadly, no one optimistic that the obesity epidemic will be conquered any time soon. If history repeats itself, my guess is Mississippi will be the first state to reach the 35% and greater category, based on my monitoring the state obesity prevalence rates in recent years.
For more information, see CDC's Adult Obesity Facts, and Obesity Resources on the Internet |

Graphic source: http://www.cdc.gov/nchs/data/databriefs/db82.htm |
NCHS Data Brief, Number 82, January 2012's "Prevalence of Obesity in the United States, 2009-2010" shows "In 2009-2010, 35.7% of U.S. adults were obese.
More than 35% of U.S. men and women were obese in 2009-2010. There was no significant difference in prevalence between men and women at any age. Overall, adults aged 60 and over were more likely to be obese than younger adults. Among men there was no significant difference in obesity prevalence by age. Among women, however, 42.3% of those aged 60 and over were obese compared with 31.9% of women aged 20-39." Citation source: http://www.cdc.gov/nchs/data/databriefs/db82.htm For more information, see Obesity |

Graphic source: http://apps.nccd.cdc.gov/DDT_STRS2/NationalDiabetesPrevalenceEstimates.aspx?mode=OBS |
Here are county-level data released 4/3/2012 by the CDC's Division of Diabetes Translation. "The county-level estimates help identify counties with high estimated numbers and percentages of people diagnosed with diabetes or at high-risk of diabetes." Source: CDC 4/3/2012 E-mail: CDC releases 2009 county-level estimates of diagnosed diabetes, obesity, and leisure-time physical inactivity in the United States |

Graphic source: http://meps.ahrq.gov/mepsweb/data_files/publications/st364/stat364.shtml |
Highlights of AHRQ's March 2012's STATISTICAL BRIEF #364:
Obesity in America: Estimates for the U.S. Civilian Noninstitutionalized Population Age 20 and Older, 2009 include:
In the above chart, what I found most interesting was those ages 45-64 have more of an issue with weight than those in the 65+ age group. Granted there was a higher percentage of overweight, there was also a higher percentage for normal weight and lower percentage for those obese. For more information, see Obesity |

Graphic source: http://www.hivehealthmedia.com/world-obesity-stats-2010/ |
| According to Hive Health Media, the news is not good - obesity is everywhere, "Rates are highest in the United States and Mexico and lowest in Japan and Korea, but have been growing virtually everywhere."
But more importantly, here is how obesity is hurting the U.S. on the international stage. According to a UK site, "America is frequently ridiculed for its inhabitant's unwillingness to walk rather than drive. And although the criticism is short sighted, it is at least common with the theme that America is not perceived as a healthy or wise nation by many. Many people consider it a shocking symptom of Western indulgence and neglect that the richest nation has the highest obesity levels and still has problems with illiteracy, homelessness, etc." (Citation source: http://www.vexen.co.uk/USA/hateamerica.html#Obesity) Ouch! |
 Creation of new rift in the Pine Island Glacier (Caught on camera 10/26/2011) Graphic source: http://earthobservatory.nasa.gov/IOTD/view.php?id=77266&src=eoa-iotd |

Graphic source: http://www.vexen.co.uk/countries/best.html |

Graphic source: http://www.diet-blog.com/07/a_picture_of_obesity_around_the_world.php |

Graphic source: http://www.cdc.gov/nchs/data/hestat/obesity_child_07_08/Figures1.png |

Graphic source: http://www.cdc.gov/nchs/data/hestat/obesity_child_09_10/obesity_child_09_10.html |
Here are National Center for Health Statistics Childhood Obesity Trends, from different time periods. Regardless of which time period, childhood obesity rates are on the rise. Something definitely needs to be done or this current generation of children will suffer earlier onset of chronic diseases associated with obesity, such as Type 2 diabetes which puts those with this disease at increased risk for heart disease.

Graphic source: http://pharmamkting.blogspot.com/2012/04/type-2-diabetes-in-obese-children.html |

Graphic source: http://www.infographicsinsights.com/2011/03/obesity-in-america-facts-lies-and.html |
 Graphic source: http://books.google.com/ngrams/graph?content=Childhood+Obesity&year_start=1950&year_end=2012&corpus=0&smoothing=3 |
Is childhood obesity just a passing fad? Probably not. But, it is a growing trend. Here is a graph from the Google's Ngram Viewer that looks at the frequency of "childhood obesity" in the books accessed by Google. I decided to look at the time period since 1950. For sure this indicates that childhood obesity is a growing problem since the 1970s.
For the next couple of weeks, because it is National Childhood Obesity Awareness Month, I am going to concentrate on exactly what we really know about obesity. I will present whatever obesity statistics I can find online to quantify what we have to deal with. Once we know the numbers we will have a better idea of the magnitude of the problem. For more information, see Childhood Obesity |
 |
I am glad to see that there is a whole month to raise awareness about childhood obesity. It is a growing problem with no end in sight unless we pool our resources and energies to address this public health issue. If we don't, then we will just have to look forward to the growing numbers of adults suffering from chronic diseases, at earlier ages, that are associated with adult obesity: diabetes, heart disease, cancer, arthritis, etc.
Click on the graphic for more information. I have devoted a whole Webpage to obesity, check it out |
 |
According to "Health, United States, 2011" (35th annual report with health data through 2010):
Click on graphic to access the report. For additional data, see Public Health Data |

Graphic source: http://www.marketingcharts.com/topics/demographics/education-age-mean-steadier-household-net-worth-22412/census-net-worth-education-level-june2012png/ |
In a precarious economy, education still counts when it comes to net worth. According to Marketingcharts.com:
So, if you are smart, stay in school and learn as much as you can! |

Graphic source: http://swampland.time.com/2010/03/09/stay-in-school/ |
Here is another way of looking at the importance of a college education - the likelihood of being unemployed. Those with less education are more likely to be unemployed. That is not to say that having a college education doesn't make you totally immune to unemployment, but they make up a lower percentage of those who are out of a job.
According the New York Times 7/20/2012 article,"Is It Worth It?"
|

Graphic source: http://www.highschooleducationcoach.com/education-news/governing-to-win/ Being an educator, of course, I think education is very important for quality of life. One needs a good education to provide a foundation with which to deal with Life, but most of all, to be able to make a living and support ourselves, and to also do the things we want to do that make life worth living. |
Up until the early 1900s, Americans can pretty much get by without a high school education. That was because the country was mostly agrarian, and in order to grow crops what was really important was having a green thumb and cooperative weather conditions. One can really get by with a sixth grade education, if one was lucky enough to get it. But with a couple of world wars and the change in economic conditions, more education meant more opportunities off the farms. Post-WW II saw the baby-boom generation take hold, and by the 1960s, a college education meant opportunities to become part of the middle class. (Okay, this is just a brief overview, but you should have learned about this high school U.S. history)
Today a high school diploma is an absolute necessity and it is quickly becoming replaced with a college education, beginning with an associate degree. To really assess the value of an education one only need to ask employers what they are looking for in education attainment.
Given the sad shape of the current economy, having a high school diploma is the barest minimum to survive, but to compete for whatever jobs are out there, you really need a minimum of a 2-year college degree, and getting a 4-year college degree would be optimal. And, that's just to compete for a decent paying job. That is the reality today. |


Graphic source: http://winginstitute.org/Graphs/Student/High-School-Graduation-Rates/ |
Here is a line chart from the Wing Institute that looked at 2008 Census data. It concluded:
"1940 to 1990 shows a dramatic increase in percent of U.S. residents 25 years or more year olds with four or more years of high school. In 1940 about 26% of Whites and 7% of Blacks had 4 or more years of high school. By 1990 about 79% of Whites and 66% of Blacks had four or more years of high school. No data is available for Hispanics until 1974 and for Asians until 2003. By 2006 about 87% of Asians, 86% of Whites, 81% of Blacks, and 59% of Hispanics had four or more years of high school. From about 1974 to 2002, Blacks with four or more years of high school has improved dramatically from nearly the same as Hispanics (40%) to nearly the same as Whites (83%). Hispanic graduation rates have not improved nearly as much as that of Whites and Blacks. In the late '90s and early '00s the improvement in graduation rates of all groups slowed." Data source: Source: 2008 United States Census
http://www.census.gov/population/socdemo/education/cps2008/tabA-2.xls
|

Map source: http://earthobservatory.nasa.gov/IOTD/view.php?id=78869&src=eoa-iotd According to the National Climatic Data Center (NCDC) of the National Oceanic and Atmospheric Administration (NOAA):
|
|
 |
 |
 |
 |
 |
 |
 |
Let us never forget all the innocent lives that were lost on that fateful day, and once again thank all the brave civil servants who died in the line duty. Many thanks to Suzanvitti.org for these wonderful graphics.
 |
 |
For more information about what is currently known about global warming, see Global Change & Warming


Graphic source: Enlarged graphic from source |
| According to the National Oceanic and Atmospheric Administration, the average global land and ocean temperatures for November 2011 was the 11th warmest November on record, since 1880!
This graphic summarizes all the various anomalies recorded across the world for that month. For sure, something is going on with the climate. See http://www.stonehearthnewsletters.com/global-temperatures-12th-warmest-on-record-for-november/climate/ for additional information. |

Graphic source: http://earthobservatory.nasa.gov/Features/HottestSpot/?src=eoa-features |
So, it was a really hot summer that resulted in a drought that is being compared to the early 1900s dustbowl. But even as hot as it was, how does it compare to what's going on with the rest of the world?
According to NASA's April 5th report,"Where Is the Hottest Place on Earth? It Lies Somewhere Between Folklore and Science, the Desert and the City," here is a map of the hottest places on Earth. At present, it is an inexact science, but they range from 134 to 175 degrees! The highest temperature recorded was at the Flaming Mountain, a ridge of dark red sandstone on the edge of the Taklimakan Desert and the Tian Shan range in China.
|

Graphic source: NASA Earth Observatory image by Jesse Allen, Earth Observatory,using data provided by Inbal Reshef, Global Agricultural Monitoring Project. Caption by Adam Voiland. Now that summer is over, we should look back at what this summer really means, within the larger scheme of things. Was it hot or what? "On July 11, the United States Department of Agriculture announced that more than 1,000 counties in 26 states qualified as natural disaster areas�the largest total area ever declared a disaster zone by the agency."
|


Graphic source:http://www.cdc.gov/VitalSigns/HIVTesting/ |
According to the CDC, "Too many people don't know they have HIV (human immunodeficiency virus). About 1.2 million people are living with HIV in the US but about 240,000 don't know they are infected. Each year, about 50,000 people get infected with HIV in the US. Getting an HIV test is the first step to finding out if you have HIV and getting medical care. Without medical care, HIV leads to AIDS (acquired immunodeficiency syndrome) and early death."
Once a person becomes infected with HIV, it is for life. So the best strategy for stopping HIV is to not get infected in the first place. This means practicing safe sex, if you are sexually active, avoiding risky sexual behaviors, avoiding contaminated needles, etc. However, if a person is infected, treatment is available. It is therefore essential that people get tested, and if positive, treatment can be started right away.
For information regarding treatment, see federally approved HIV/AIDS medical practice guidelines are available at Clinical Guidelines Portal Additional information can be found at: AIDS/HIV |

|
Click on title to access the Healthy People 2020 page on HIV. |
 |
During July 22-27, 2012, AIDS 2012, the first International AIDS Conference was held in the United States in more than 20 years. This conference raised awareness that this infectious disease continues to affect millions.
|

It is hard to believe that it has been 13 years since I published the first webpages that turned into this Web site. Many thanks to the thousands of visitors who contributed millions of hits during the past 13 years, and for all the nice comments along the way. I will continue to strive to make this Web site a worthwhile place to spend your time and find credible public health and health information.
 |

 |
 Here is the recently released report about the progress that the U.S. is making in addressing AIDS. Just click on the graphic to access the report. Here is the recently released report about the progress that the U.S. is making in addressing AIDS. Just click on the graphic to access the report.
|

Graphic source: http://www.medscape.org/viewarticle/768042_transcript |
The epidemiological picture of HIV infection show those at greatest risk are young Black men having sex with men. Because transmission is behavioral, interventions should also have a behavioral focus.
|

Graphic source: http://www.medscape.org/viewarticle/768042_transcript | ||
| According to Medscape's "HIV Prevention: Successful Approaches for Young Men Who Have Sex With Men":
|

Graphic source: http://www.cdc.gov/hiv/topics/surveillance/resources/slides/general/index.htm |
CDC HIV infection surveillance data show that 77% of men were infected by the AIDS virus through male-to-male sexual contact. This was followed by 12% through heterosexual contact, 7% by injection drug use and 4% by male-to-male sexual contact and injection drug use.
This is very different from how women became infected. For women, 86% of women were infected through heterosexual contact, and 14% through injection drug use. |

Graphic source: http://www.cdc.gov/hiv/topics/surveillance/resources/slides/general/index.htm |
In my August 9th posting, I mentioned that male-to-male sexual contact was the most common form of transmission for the HIV infection.
|

|
According to an August 9th CDC E-mail: "The most significant change to the new guidelines is that CDC no longer recommends an exclusively oral treatment regimen for gonorrhea. CDC now recommends a dual therapy of injectable ceftriaxone in combination with a second antibiotic. Ceftriaxone is more potent against gonorrhea than the once recommended oral antibiotic cefixime and, when paired with the additional oral antibiotic, might slow the emergence of drug resistance by ensuring that gonorrhea infections are quickly cured."
Click on graphic to get to the CDC page. Also, see Update to CDC's Sexually Transmitted Diseases Treatment Guidelines, 2010: Oral Cephalosporins No Longer a Recommended Treatment for Gonococcal Infections released 8/10/12. For more information, see Gonorrhea |


Graphic source: http://www.cdc.gov/hiv/topics/surveillance/resources/slides/general/index.htm |
CDC HIV Infection Surveillance 1985 to 2010 trend data show that male-to-male sexual contact is the main, or most common, route of transmission. This is followed by injection drug use (IDU) as the 2nd most common route of transmission.
While male-to-male sexual activity as a mode of transmission peaked in the early 1990s, with ~ 40,000 annual diagnoses, data trends indicate such sexual contact for transmitting HIV has been decreasing. However, male-to-male sexual contact remains the main route of transmission, when compared to other modes of transmission between 1985 - 2010. Note that transmission through heterosexual contact has been slowly increasing over time. |

Graphic source: http://www.cdc.gov/hiv/topics/surveillance/resources/slides/general/index.htm |
This map of CDC HIV Infection Surveillance data shows the rates for diagnoses of HIV infection varies across the U.S. Those states with the highest rates for diagnosis of an HIV infection include: Florida, Georgia, Louisiana, New Jersey and New York |

Graphic source: http://www.cdc.gov/hiv/topics/surveillance/resources/slides/general/index.htm |
Recent CDC HIV Infection Surveillance data show men and women are affected by AIDS in a different way. While African-Americans males make up 41% of 2010 HIV infection diagnoses for men, African-American females make 62% of 2010 HIV infection diagnoses for women! |

Graphic source: http://fohn.net/history-of-aids/history-of-aids-3.html |
Here is a graphic of the natural history of an HIV infection. It is the course that the immunodeficiency virus (HIV) virus takes inside the infected person, regardless of how the infection was contracted (e.g., unprotected sex, contaminated needles or blood transfusions, etc.)
Initial flu-like symptoms can be very mild and may be overlooked. So, it is important to get tested if you recently have had unprotected sex. |


Graphic source: http://www.boston.com/news/specials/aids_at_25/audio/aids_timeline2/ |
|
Other US Timelines
|
Global Timelines

Graphic source: http://dailyinfographic.com/outbreak-historys-deadliest-pandemics-infographic Enlarged Graphic |
While millions have died from AIDS since 1981 in the U.S., when it was finally identified as such, it still pales in comparison to other pandemics that have killed millions, like smallpox. However, given time, AIDS will probably catch up to the recorded major infectious disease killers. |

Graphic by Betty C. Jung, Data source: http://www.avert.org/worldstats.htm |
The 2012 International AIDS Conference held in Washington, DC has generated a lot of interest in AIDS. For the next several weeks I will give AIDS the "Betty Treatment," which means I will compile the most current information about what we know and what we are doing about AIDS and present it in this blog. I will provide a brief perspective on global AIDS statistics, but will be concentrating on what's going on in the U.S. about AIDS.
To start, here is the most current global statistics about AIDS. Daunting. Sub-Saharan Africa currently bears the brunt of the scourge of AIDS. More current global AIDS statistics can be found on The Global HIV/AIDS Epidemic by the U.S. Global Health Policy Fact Sheet from Kaiser Family Foundation. See also AIDS/HIV statistics |


Graphic source: http://cutthefatpodcast.com/799/cut-the-fat-blog/diet-soda-and-weight-loss-do-artificial-sweeteners-cause-weight-loss-or-weight-gain |
Here are the additional 3 foods that you probably should avoid, not just for the sake of avoiding strokes, but cardiovascular disease as well.
For more information, see Stroke Information, Sodas |

Graphic source: http://talkofthetown411.blogspot.com/2011/09/5-everyday-foods-that-could-trigger.html |
Can food trigger strokes? Possibly, here are 5 foods that you probably should avoid, not just for the sake of avoiding strokes, but cardiovascular disease as well.
For more information, see Stroke Information and Nutrition |

Age-adjusted prevalence of stroke* among noninstitutionalized adults aged ≥18 years, by state Behavioral Risk Factor Surveillance System, United States, 2010 Graphic source: http://www.cdc.gov/mmwr/preview/mmwrhtml/mm6120a5.htm |
The May 2012 MMWR report on the prevalence of stroke reports, "age-adjusted prevalence of stroke among noninstitutionalized adults aged ≥18 years, by state, in the United States during 2010, based on data from the Behavioral Risk Factor Surveillance System. In 2010, the states with higher stroke prevalence generally were states in the southeastern United States and Nevada." Citation source: http://www.cdc.gov/mmwr/preview/mmwrhtml/mm6120a5.htm
For more information, see Cerebrovascular Disease |

Graphic source: http://www.immortalhumans.com/how-to-stop-your-aging-brain-from-mental-deterioration-and-shrinkage/ |
HealthDay reported on data from the Framingham Offspring Study published August 2nd, in "Neurology" that indicates good living can preserve your mental faculties:
For more information, see Cardiovascular & Chronic Disease Main Page |


Graphic source: http://www.nhlbi.nih.gov/news/spotlight/success/conquering-cardiovascular-disease.html |
Observational studies have always taken a back seat to more rigorous methods, such as randomized controlled trials. But each type of study is valuable in their own way. Randomized controlled trials are appropriate if you are looking at the effectiveness of interventions. But, if you just want to understand how phenomena changes over time, then observational studies are be very effective. Perhaps, the most well-known observational study is the Framingham Heart Study that has been going on for over 60 years.
According to the National Institutes of Health (NIH), which funds this study, "NIH researchers launched the study in the late 1940s to determine the causes of cardiovascular disease by carefully examining over 5,000 healthy people in Framingham, Massachusetts, beginning in mid-life and following them for many years to see who developed cardiovascular disease and how they differed from those who did not." (Source: http://www.nhlbi.nih.gov/new/stories/cardiovascular.htm) And, we have learned so much! The NIH's National Heart, Lung, and Blood Institute "Conquering Cardiovascular Disease" in August 2011 released this graph which clearly shows that by identifying the risk factors for heart disease, mortality has been drastically reduced. So, don't discount observational studies. If they are conducted systematically over long periods of time they can yield new knowledge that can improve our quality of life. For more information, see Cardiovascular Disease and Research Resources |

Graphic source: http://www.cdc.gov/mmwr/preview/mmwrhtml/mm6040a1.htm |
According the October 14's MMWR, " age-adjusted prevalence of coronary heart disease among adults in the United States during 2010, according to the Behavioral Risk Factor Surveillance System. By state, age-adjusted CHD prevalence in 2010 ranged from 3.7% in Hawaii and 3.8% in DC to 8.0% in West Virginia and 8.2% in Kentucky, with the greatest regional prevalences generally observed in the South." Citation source: http://www.cdc.gov/mmwr/preview/mmwrhtml/mm6040a1.htm
For more information, see Cardiovascular Disease |

NOTE: 2010 data are preliminary. SOURCE: CDC/NCHS, National Vital Statistics System, Mortality. Graphic source: http://www.cdc.gov/nchs/data/databriefs/db88.htm |
| The NCHS Data Brief,"75 Years of Mortality in the United States, 1935-2010" (Number 88, March 2012) reports that heart disease and cancer have been part of the top five causes of death for Americans for the 75 years that data were analysed.
"A 75-year perspective points to both stability and change in the leading causes of death: stability because three causes (heart disease, cancer, and stroke) remained among the five leading causes each year between 1935 and 2010; and change because other causes moved into or dropped out of the five leading causes at different points over the past 75 years (Figure 2). There were also changes in the proportion of all deaths that were due to each of the leading causes. For example, heart disease and cancer were the leading causes of death from 1935 to 2010, but it was in 1983 that these two conditions accounted for the highest percent (60 percent) of all deaths. In 2010, they constituted 47 percent of all deaths."
For more information, see Morbidity and Mortality Statistics |
 |
| A couple of weeks ago on vacation, we took the "long way home." And, what a trip it was! After visiting the Grand Coulee Dam we were returning to the Seattle area. Instead of taking the highway we took the alternate, and that really made all the difference.
From Waterville, WA go west on Route 2. You will go downhill for more than 6 miles through the most gorgeous terrain ever. You will be driving through a canyon that will take your breath away. It is simply the best ride I have ever taken. It is one ride you have to take before you die. |

Graphic source: http://www.cancer.gov/ncicancerbulletin/050112/page5 |
Disease screening is important because it can lead to a disease diagnosis and early treatment. However, inappropriate screening can compromise health care quality.
The National Cancer Institute's "Crunching Numbers: What Cancer Screening Statistics Really Tell Us" sheds light on factors we need to consider with disease screening.
Click on the graphic to learn about other screening issues as length-biased sampling (or length bias) and how to measure lives saved. For additional information, see Cancer Resources and Research Resources |

Graphic source: http://www.cdc.gov/nchs/products/other/atlas/atlas.htm |
I just love maps! I love them even more when they show more than geography! CDC's Atlas of United States Mortality is a prime example of what you can do when you map health data.
From this site you can get disease-specific mortality maps. Really, a great Public Health resource! For more information, see U.S. Federal Government Statistics and Public Health Data Index Page |

|
"An autopsy, the medical examination of a deceased person, may confirm clinical findings, provide more complete information to describe cause of death, or uncover conditions not recognized clinically prior to death. Two types are performed in the United States: a) hospital or clinical autopsies, which family or physicians request to clarify cause of death or assess care, and b) medicolegal autopsies, which legal officials order to further investigate the circumstances surrounding a death."*
Autopsies are an important part of understanding disease processes. After all, an autopsy provides the final evidence as to whether or not a proper diagnosis has been made. Such knowledge does improve the quality of medical care. Unfortunately, autopsies are not viewed this way by most people because of the way we commonly view death, something to be ignored and avoided. When a person dies, the last thing surviving members of the person's family want to think about is advancing the practice of Medicine. Perhaps, if more of us can think of donating our bodies for an autopsy (as in donating your body to science), we can contribute something to improving medical care. In the NCHS Data Brief (Number 67, August 2011),"The Changing Profile of Autopsied Deaths in the United States, 1972-2007"
|


 Click on graphic to learn more about what was covered at this conference.


