The Difference between Raw Data and the Stories Data can tell. :)
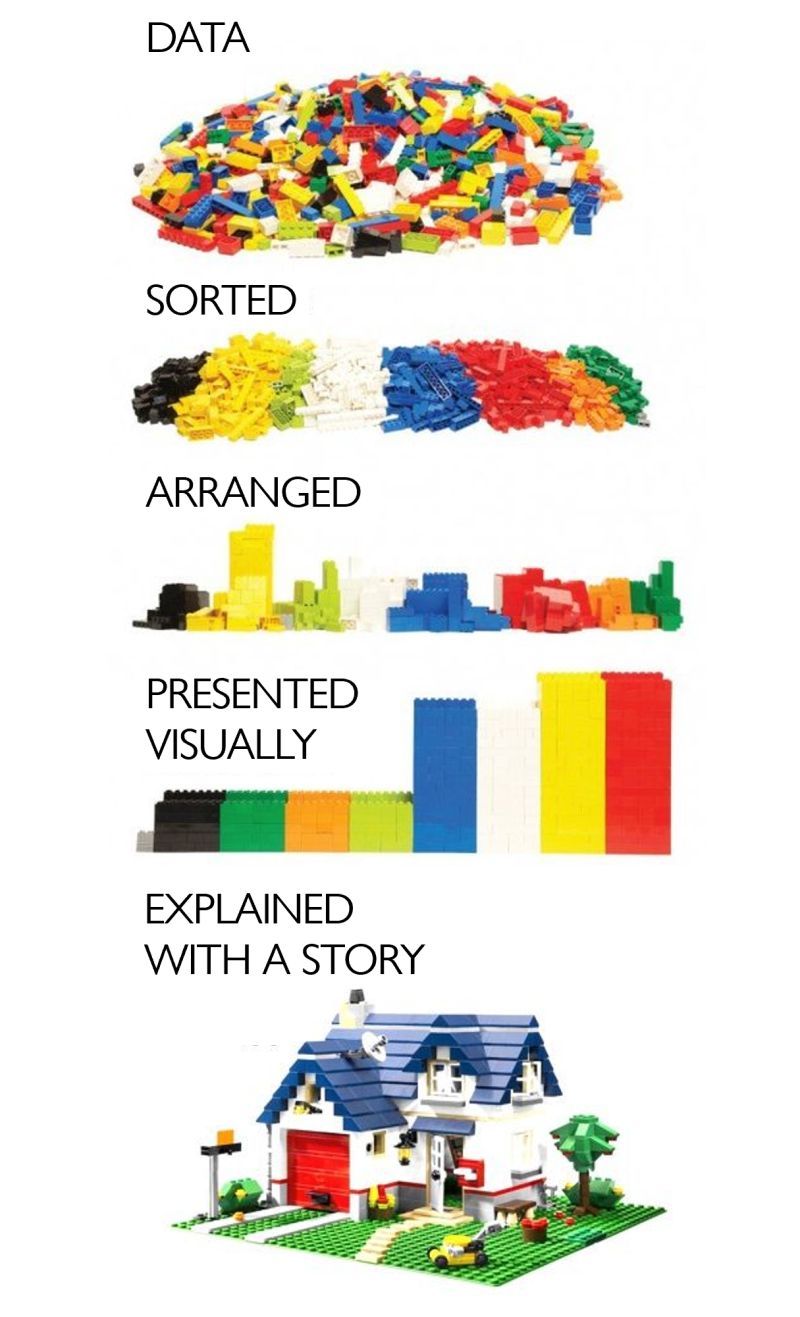
Graphic source: Andreas von der Heydt, Vice President Merchandising at Chewy

Graphic source: https://psych-networks.com/meaning-model-equivalence-network-models-latent-variables-theoretical-space/


 5 Megatrends Fueling the Rise of Data Storytelling 7/2022