Suggested Citation: Jung, B.C. (2020-2026). COVID-19 (Betacoronavirus pandemicum) Internet Resources.
https://www.bettycjung.net/COVID-19.htm
Mission: To provide a one-stop Web resource page with factual information about the COVID-19 Pandemic
According to PEW , social media users share COVID-19 information mostly from news sources (74%) and very little from health and science resources (1%). This could mean that people do not know where to look for credible science-based information about COVID-19.
On June 18, 2020, JAMA reported "Coronavirus disease 2019-related knowledge and behaviors were associated with race/ethnicity, sex, and age. African American participants, men, and people younger than 55 years were less likely to know how the disease is spread, were less likely to know the symptoms of coronavirus disease 2019, and left the home more often."
Furthermore, the prevalence of Coronavirus myths addressed by the World Health Organization indicates that there is much disinformation and misinformation on the Internet about the SARS-CoV-2 virus.
Therefore, I have decided to create this resource page for those interested in learning more about the pandemic. It is my hope, as Master Certified Health Education Specialist (MCHES®), that you will be able get the credible information you need here to make the decisions you have to make to deal with the pandemic in your life. I am dedicated to keeping this page updated with vetted sources, and welcome your feedback. (July 6, 2020)
Table of Content (Major sections)
The dangers of pandemic revisionism (Dr. Katelyn Jetelina)
Fueling the dismantling of our public health infrastructure is pandemic revisionism-the rewriting of history from the comfortable vantage point of 2025, where we now enjoy the benefits of immunity, scientific knowledge, and hindsight.
Let's be crystal clear: In the first year of the pandemic, we faced a crisis with literally no vaccine, no treatment, terrible diagnostics, no surveillance system, and no federal plan. Outbreaks were widespread, hospitals were overwhelmed, and people were dying. This is not hyperbole-this was our reality.
We must be able to hold two truths: 1. Mistakes were made. 2. Public health demonstrated remarkable resilience. Revisionist narratives often erase the second truth.
Graphic source: https://www.gao.gov/assets/gao-25-107588-highlights.pdf
Graphic source: March 28, 2025 Your Local Epidemiologist
COVID-19 Pandemic/U.S. Public Health Emergency Ended 5/11/2023
CDC has three numbers you should consider to know if you've been exposed to the coronavirus: If you've been within six feet of an infected person for at least 15 minutes starting from 48 hours before the infected person began feeling sick, you are considered to have been in close contact with the virus.
December 14, 2024
Graphic source: https://www.nature.com/articles/d41586-021-02741-x
VIDEO
Graphic source: What Is a #Pandemic? https://jamanetwork.com/journals/jama/fullarticle/2726986
A build-up of 21st century forces resulting in illness
Graphic source: https://www.bmj.com/content/373/bmj.n657
Covid-19 six years later 6/2026 Your Local Epidemiologist COVID-19: Make it the last pandemic The Independent Panel.org COVID-19:
Update on Key Indicators, the Federal Response, and Implementation of GAO Recommendations 7/31/2025 GAO.gov Covid followed 5 standard stages of pandemic response - until it became unprecedented. MAGA's Covid scapegoats leave us less prepared for the next deadly pathogen Stat, 3/2026 Pandemic Mitigation Collaborative (PMC) 5 Years After Covid Hit 67% Say They or Family Member Had the Disease, 45% Experienced Financial Hardship, 31% Had a Job Loss, 36% Lost a Loved One 4/2025 5 Years Later: America Looks Back at the Impact of COVID-19. Most Americans say the pandemic drove the country apart 2/2025 17 key charts to understand the COVID-19 pandemic. The pandemic has resulted in over twenty million deaths. 11/2024 AHRQ 2023 National Healthcare Quality and Disparities Report 1/2024 Are we ready for the next pandemic? 3/2025 COVID-19 Surveillance After Expiration of the Public Health Emergency Declaration ― United States, May 11, 2023 5/12/2023 MMWR End of PHE: A shift in data 5/2010 End of the Federal COVID-19 Public Health Emergency (PHE) Declaration 5/5/2023 CDC.gov Fact Sheet: End of the COVID-19 Public Health Emergency 5/9/2023 HHS.gov As COVID turns 3, experts worry where the next pandemic will come from – and if we'll be ready 2/2023 A Timeline of COVID-19 Developments in 2020 1/2021 Facing the New Covid-19 Reality 2/2023 COVID-19:
GAO Recommendations Can Help Federal Agencies Better Prepare for Future Public Health Emergencies 7/2023 GAO.gov
First Case of COVID-19 in NYC, First Death Reported in Washington State March 1, 2020 A tale of 2020 in 20 McKinsey charts 12/2020 Coronavirus Disease 2019 (COVID-19) CDC.gov COVID-19 Coronavirus Tracker KFF.org Coronavirus - seven steps to prevent the spread of the virus via @YouTube COVID-19 Conversations Covid-19: a disaster five years in the making BMJ.com 4/2021 5 reasons the pandemic is so very far from over. 6/2020. No matter what else happens, the coronavirus isn't going away. 5 Things Everyone Should Know About the 2019 Novel Coronavirus 1/2020 Yalemedicine.org 11 questions about the coronavirus we still can't answer. 5/2020. Here's what we don't know about the coronavirus and why it really matters. A Timeline of the Coronavirus Pandemic Continuous. NY Times. A Viral Epidemic Splintering Into Deadly Pieces 7/2020 Coronavirus, explained: Everything to know about COVID-19, the deadly virus alarming the world 3/2020 USAToday Coronavirus outbreak: Live updates Continuous COVID-19 in the Fall of 2023—Forgotten but Not Gone 9/2023 JAMANetwork COVID-19 Turns 5: Looking Back And Looking Forward 1/2025 Forbes.com Essential Vocab For COVID-19: From Asymptomatic To Zoonotic 6/2020 NPR Facts about novel coronavirus and how to prevent COVID-19 Seattle Times Honesty About Covid is Essential for Progress 5/2024. John Snow Project How did we get here Retrospective from ABC news video 'I hope you die': how the COVID pandemic unleashed attacks on scientists. Dozens of researchers tell Nature they have received death threats, or threats of physical or sexual violence. 10/2021 Nature.com Must-Know Vocab For COVID-19: From Droplets To Zoonotic 1/2020 NPR.org Novel Coronavirus (2019-nCoV) WHO.int Novel coronavirus (2019-nCoV) @WHO via @YouTube Our New COVID-19 Vocabulary: What Does It All Mean? Yale Medicine Outbreak Info
Pathophysiology, Transmission, Diagnosis, and Treatment of Coronavirus Disease 2019 (COVID-19) A Review 7/2020 A pandemic year. Sorrow and stamina, defiance and despair. It's been a year. 3/2021 Six lessons the UK should have learned, one year on from its first lockdown 3/2021 Six Rules That Will Define Our Second Pandemic Winter. The pandemic keeps changing, but these principles can guide your thinking through the seasons to come. 9/2021 The Coronavirus Explained & What You Should Do via @YouTube The Coronavirus in America: The Year Ahead 4/2020 NY Times The ‘End’ of COVID Is Still Far Worse Than We Imagined. Even now, the coronavirus is killing three times as many people as the flu. 9/2022 The John Snow Project
@JohnSnowProject Reliable, honest information on COVID-19 from public health, clinical, and research experts. The novel Chinese coronavirus, everything you need to know 1/2020 ZME Science The Vox guide to navigating the coronavirus crisis The world is nowhere near the end of the Covid pandemic, says famed epidemiologist Larry Brilliant 8/2021 Three Years Later, Covid-19 Is Still a Health Threat. Journalism Needs to Reflect That
Too much coverage minimizes the health risks researchers attribute to the virus 4/2023 Timeline: How Trump Has Downplayed The Coronavirus Pandemic NPR.org, 10/2020 Updated WHO COVID prevention guidance may endanger rather than protect, some experts say 1/2026 We Can Do This: An Assessment of the Department of Health and Human Services’ COVID-19 Public Health Campaign 10/2024 What COVID-19 Does to the Body (9th Edition, September 2025)
Your Regular COVID-19 Research Update (80+ Studies) Pandemic Index What you should know about COVID-19 to protect yourself and others CDC.gov When will it be over? 3 key numbers scientists are watching to track the pandemic. There won't be an on/off switch for the pandemic, but epidemiologists are watching certain metrics for signs of improvement. 3/2021 Why I Hope the COVID Pandemic Isn't Over - More dwindling before it "ends" would promote better health outcomes 1/2024 Why Pandemics Give Birth To Hate: From Bubonic Plague To COVID-19 3/2021
Back to Table of Contents
Public Health Technical Reports
All around the world, covid surveillance is faltering. That, rather than the surge of cases in China, is the main reason for worry 1/2023 Best practices for government agencies to publish data: lessons from COVID-19 Lancet.com 4/2024 COVID Data Tracker Weekly Review CDC.gov COVID-19 Data Review: Update on COVID-19–Related Mortality 11/2022 CDC.gov Community Profile Report Healthdata.gov Weekly report Biden's COVID Plan Offers a Path Out of the Pandemic - The layered approach is bold and unequivocally legal 9/2021 CDC updates are straining already-pressed public health departments. With an already-weary public tuning out rules and with omicron surging, some public health professionals are struggling to explain recent changes in federal guidance. 1/2022 Confronting health misinformation - The U.S. Surgeon General's Advisory on Building a Healthy Information Environment 2021 Coronavirus disease (COVID-19) Epidemiological Updates and Monthly Operational Updates WHO.int COVID-19 Key Insights from GAO's Oversight of the Federal Public Health Response 2/2021 COVID-19: Make it the Last Pandemic - Main Page 5/2021 Independent Panel for Pandemic Preparedness and Response. Links to supporting documentation COVID-19 Odds
Quantitative analyses on the global coronavirus pandemic 3/2022 COVID-19: Make it the Last Pandemic: The main report presents the Panel's findings and recommendations. 5/2021 COVID-19: Make it the Last Pandemic: A Summary. 5/2021 COVID-19 Science Update CDC.gov COVID-19: Significant Improvements Are Needed for Overseeing Relief Funds and Leading Responses to Public Health Emergencies 1/2022 COVID response exposed "collective national incompetence," commission says 4/2023 Five COVID Numbers That Don’t Make Sense Anymore. It’s long past time to forget them all. 6/2022 How Can Public Health Officials Increase Trust in Their Agencies?
— Using science and giving clear recommendations would help, survey suggests 3/2023 Watchdog says key federal health agency is failing on crises 1/2022 How an Outbreak Became a Pandemic: The defining moments of the COVID-19 pandemic - The companion evidence-based narrative describes 13 defining moments which have shaped the course of the pandemic. 5/2021 Improving communications around vaccine breakthrough and vaccine effectiveness 7/2021 CDC Occupational Exposure to COVID-19; Emergency Temporary Standard Federal Register 7/2021 Occupational Exposure to COVID-19; Emergency Temporary Standard Federal Register 7/2021 PDF Version APIC Assessment of the OSHA COVID-19 Emergency Temporary Standard June 30, 2021 Too Much, Too Late: Health Groups Pan OSHA Rule on COVID Precautions - Applies to any healthcare setting, including nursing homes and home health 7/2021 Public Health 101 failure: CDC mask decision may knock out Biden's workplace Covid crackdown 5/2021 Proposed Limits on Public Health Authority: Dangerous for Public Health NACCHO May 2021 Report of the WHO-China Joint Mission on Coronavirus Disease 2019 (COVID-19). February 16-24, 2020 MMWR - COVID-19 Reports 50 Top Legal Experts Find U.S. Policy Response to COVID-19 Dangerously Lacking, Recommend Steps to Safeguard Health, Civil and Human Rights 8/2020 A Glossary of Key Terms CDC.gov A guide to WHO's guidance on COVID-19 America's Covid-19 deaths, explained in 8 charts and maps 2/2021 Brief Update on Initial Federal Response to the Pandemic 8/2020 Children and COVID-19: State Data Report - A joint report from the American Academy of Pediatrics and the Children's Hospital Association 4/23/2021 Coronavirus Disease 2019 (COVID-19) Frequently Asked Questions FDA.gov 2019-novel Coronavirus (COVID-19) Facts & Misconceptions(Multilingual) 3/2020 Coronavirus gets official name from WHO: COVID-19 2/11/2020 Coronavirus Oversight 6/2020. An ongoing review of the federal response to the COVID-19 pandemic and oversight of related spending. Coronavirus disease (COVID-2019) situation reports WHO.int Country & Technical Guidance - Coronavirus disease (COVID-19) WHO.int Covid-19: A Year In Review Connecticut COVID-19 New Insights on a Rapidly Changing Epidemic 2/2020 COVID-19 : Opportunities to Improve Federal Response and Recovery Efforts Report to the Congress 6/25/2020 COVID-19 - a global pandemic. What do we know about SARS-CoV-2 and
COVID-19? WHO.int 05 June 2020
COVID-19: Urgent Actions Needed to Better Ensure an Effective Federal Response GAO.gov 11/2020 Dear Colleague, COVID-19 Updates May 31 - June 6, 2020 New York City Department of Health and Mental Hygiene Updated guidance and scientific literature on COVID-19 European Centre for Disease Prevention and Control - COVID-19 pandemic How Your Brain Tricks You Into Taking Risks During the Pandemic 11/2020 Inside the Fall of the CDC 10/2020
MORE EFFECTIVE MORE EFFICIENT, MORE EQUITABLE YEAR-END STAFF REPORT
Overseeing an Improving & Ongoing Pandemic Response 12/2021 House.gov Report of the WHO-China Joint Mission on Coronavirus Disease 2019 (COVID-19) February 16-24, 2020 WHO.int Scientific consensus on the COVID-19 pandemic: we need to act now 10/2020 Select Subcommittee on the Coronavirus Crisis - Preparing for and preventing the next public health emergency: Lessons Learned from the Coronavirus Crisis. Final Report, December 2022 House Subcommittee Report Details Pandemic Failures, Lessons Learned — "This outcome was not inevitable," subcommittee chair says 12/2022 Shut it down, start over, do it right 7/2020 TECHNOLOGY ASSESSMENT; COVID-19 Data Quality and Considerations for Modeling and Analysis 7/2020 GAO.gov The COVID-19 Pandemic in the US A Clinical Update 4/2020 Timeline: WHO's COVID-19 response Interactive Timeline of WHO's response to COVID-19 Continuous Tips for professional reporting on COVID-19 vaccines 12/2020 US House of Representatives - Permanent Select Committee on Intelligence Report 8/2022 Report: Intelligence agencies didn’t move fast enough to collect Covid data
The report by Democrats on the House Intelligence Community says the CIA and other spy agencies "took too long to pivot." 12/2022 US should have attacked COVID like a foreign invasion, experts say. Have we learned any lessons? 4/2023 Webinar for journalists and communicators: Covering COVID-19 vaccines in a responsible and evidence-based manner. PAHO.org WHO says Covid pandemic is growing "exponentially" at more than 4.4 million new cases a week 4/2021 WHO-convened global study of origins of SARS-CoV-2: China Part. Joint WHO-China study: 14 January - 10 February 2021 3/2021 Joint Report - ANNEXES 3/2021 Joint Statement on the WHO-Convened COVID-19 Origins Study 3/30/2021 Surprising Nuggets From The WHO Report: Our Science Correspondent Digs In 4/2021 NPR.org
Back to Table of Contents
COVID-19 Research Information
AACR REPORT ON THE IMPACT OF COVID-19 ON CANCER RESEARCH AND PATIENT CARE 2/2022 AACR REPORT ON THE IMPACT OF COVID-19 ON CANCER RESEARCH AND PATIENT CARE Actual Report/PDF 2/2022 COVID-19/SARS-CoV-2 Studies Google Docs Listing Coronavirus disease (COVID-19) Weekly Epidemiological Updates and Monthly Operational Updates WHO.int COVID-19 Science Weekly Updates CDC.gov A COVID-19 Primer: Analyzing Health Care Claims, Administrative Data, and Public Use Files AHRQ COVID-19 Resources Analysis of the COVID-19 Epidemic Can an Algorithm Predict the Pandemic's Next Moves? 7/2020. Researchers have developed a model that uses social-media and search data to forecast outbreaks of Covid-19 well before they occur. Communicating Science in the Time of a Pandemic 7/2020 Coronavirus news and resources for global health researchers NIH.gov Coronavirus Disease (COVID-19) The Center's latest survey research and analysis related to the coronavirus outbreak. Coronavirus: Latest news and resources BMJ.com Coronavirus COVID-19: 15 Sites You Can Trust for Reliable Information Makeusof.com COVID-19 Curated Data, Modeling, and Policy Resources COVID-19 Resource Guide for the Columbia Community COVID-19 Spread Simulator COVerAGE-DB: A database of COVID-19 cases and deaths by age Dear Colleague COVID-19 Updates, New York City Department of Health and Mental Hygiene Updated guidance and scientific literature on COVID-19 4/2020 NYCDOH Epic Research Data Tracker HKU-led study accurately tracks COVID-19 spread with big data 4/2020 How many animal species have caught COVID? First global tracker has (partial) answers 8/2022 How to "Do Your Own Research" on Hydroxychloroquine and COVID-19 7/2020 KFF Health Tracking Poll - Early April 2020: The Impact Of Coronavirus On Life In America 4/2020 National Institutes of Health COVID-19 NeuroDatabank and NeuroBioBank NIH launches database to track neurological symptoms associated with COVID-19 NCI Serological Sciences Network for COVID-19 (SeroNet) NHLBI's COVID-19 Guidance for Researchers NIAID STRATEGIC PLAN FOR COVID-19 RESEARCH FY2020-FY2024 April 22, 2020 NIH-Wide Strategic Plan for COVID-19 Research National Institutes of Health (NIH) Oxford COVID-19 Evidence Service Rapid reviews of primary care questions relating to the coronavirus pandemic, updated regularly. Pandemic preprints - a duty of responsible stewardship 4/2021 Plug COVID-19 research gaps in detection, prevention and care 7/2020 Projecting the transmission dynamics of SARS-CoV-2 through the postpandemic period 4/2020 Report highlights the skyrocket, peak of highly cited COVID-19 research studies 9/2023 Responding to Coronavirus, Cancer Researchers Reimagine Clinical Trials 7/2020 SARS-ANI VIS. A Global Open Access Dataset of Reported SARS-CoV-2 Events in Animals Last updated 12/27/2022 Statistical Considerations for Clinical Trials During the COVID-19 Public Health Emergency Guidance for Industry FDA.gov 6/2020 The Choice Institute COVID-19 Platform State of Washington statistics The Pandemic Is Pushing Scientists To Rethink How They Read Research Papers 7/2020 Variation in Government Responses to COVID-19 Final Report 6/2023 University of Oxford Virusworld Scoop.it Will there be a COVID winter wave? What scientists say. Emerging variants and waning immunity are likely to push infections higher in the northern hemisphere as influenza also makes a comeback. 10/2022 Nature.com
Back to Table of Contents
COVID-19 Databases, Registries, Repositories Back to Table of Contents
CDC & Other Federal Agency Guidance
Back to Table of Contents
Public Health Issues
Graphic source; NY Times
Graphic source; https://www.vox.com/2020/5/28/21270515/coronavirus-covid-reopen-economy-social-distancing-states-map-data
Graphic source; https://www.vox.com/2020/5/28/21270515/coronavirus-covid-reopen-economy-social-distancing-states-map-data
America’s Covid-19 death toll has surpassed 400,000
The coronavirus has officially killed more Americans than World War II. 1/2021 America's uniquely bad Covid-19 epidemic, explained in 18 maps and charts. The US's coronavirus epidemic is among the worst. Here's what you need to know. 8/2020 CDC Document Shows Just How Badly the U.S. Is Handling Coronavirus Compared to Other Countries 6/2020 Cognitive Bias and Public Health Policy During the COVID-19 Pandemic 6/2020 COVID-19 in the U.S., One Year Later - Patient's treatment similar to care for moderate, hospitalized illness today 1/2021 COVID-19 Screenings at U.S. Airports Remain Inconsistent. Experts say the lack of effective virus screenings or contact tracing plays a role in the spread of COVID-19 in the country. 8/2020 Don't blame the weather for fall COVID-19 spikes 11/2020 Expert report predicts up to two more years of pandemic misery 5/2020 Gaps in early surveillance of coronavirus led to record-breaking US trajectory 8/2020 How Did It Come to This? The Delta variant is winning, for the moment, and the CDC's coronavirus map shows that we're failing to fight it. 7/2021 How does the coronavirus outbreak end? 3/2020 Government's failure to contain the coronavirus means it may be here to stay. Inconsistencies in data presentation could harm efforts against COVID-19
New research shows broad array of different content, formats in data available on national public health institutes' websites 8/2020 Inside the Fall of the CDC 10/2020 Is COVID-19 here to stay? A team of biologists explains what it means for a virus to become endemic 11/2021 One Year, 400,000 Coronavirus Deaths: How the U.S. Guaranteed Its Own Failure
After the White House declined to pursue a unified national strategy, governors faced off against lobbyists, health experts and a restless public consumed by misinformation. 1/2021 Order to Reclassify Civil Service Posts Will Compromise Responses to Public Health Threats 10/2020 Shut down the country and start over to contain Covid-19, US medical experts urge political leaders 7/2020 'So frustrating': Grave missteps seen in US virus response 10/2020 The CDC's Delta Variant Panic. The agency spreads needless worry about vaccinations. 8/2021 The C.D.C. Needs to Stop Confusing the Public 7/2021 The inside story of how Trump's COVID-19 coordinator undermined the world's top health agency 101/2020 The Long Darkness Before Dawn
With vaccines and a new administration, the pandemic will be tamed. But experts say the coming months are going to be just horrible. 12/2020 The Pandemic Could Get Much, Much Worse. We Must Act Now. A comprehensive shutdown may be required in much of the country. 7/2020 Just 4 states meet these basic criteria to reopen and stay safe 7/2020 The 3 charts that disprove Donald Trump's convention speech. Trump wants to take credit for something he didn't do, and dodge blame for something he did do. 8/2020 The Unique U.S. Failure to Control the Virus 8/2020 The US is diving into a dark Covid hole -- and there's no plan to get out 7/2020 This Is What Fueled California's Deadly COVID Outbreak, New Study Says
MANY CORONAVIRUS DEATHS COULD HAVE BEEN AVOIDED IF THE STATE HAD BEEN BETTER PREPARED. 8/2020
Trump lied about science 9/2020 Sciencemag.org We don't have a president, or a plan. 5/2020. 60 days into the coronavirus crisis, the White House does not have a plan, a framework, a philosophy, or a goal. What happens next in the coronavirus outbreak? 2/2020. We mapped 8 scenarios. Four ways it could devolve into a dangerous pandemic, and four ways it could steadily improve. Why the U.S. Is Losing the War on COVID-19 8/2020
Back to Table of Contents
Epidemiology of COVID-19
Infectious Disease Models
Graphic source: https://www.gao.gov/products/GAO-20-582SP
Graphic source: https://www.gao.gov/products/GAO-20-582SP
COVID-19 Virology
VIDEO
Graphic source: https://www.jacc.org/doi/10.1016/j.jacadv.2024.101107
Graphic source: https://www.jacc.org/doi/10.1016/j.jacadv.2024.101107
Graphic source: https://www.jacc.org/doi/10.1016/j.jacadv.2024.101107
Graphic source: https://www.jacc.org/doi/10.1016/j.jacadv.2024.101107
Vipin M. Vashishtha
@vipintukur
The main entry point for SARS-CoV-2 into the body is ACE2 receptor. Researchers have now identified another receptor, called RAGE, present on the surface of monocytes, which can bind to SARS2 & allow it to enter cells, altering their function & leading to a worse prognosis. (https://twitter.com/vipintukur/status/1730449882379685935)
RAGE (receptor for advanced glycation endproducts) activation in monocytes was already known to correlate with more severe inflammatory outcomes, diabetes and obesity, but had never been observed in the context of viral infection. (https://twitter.com/vipintukur/status/1730450640663728347)
Graphic source: https://twitter.com/vipintukur/status/1730449882379685935
Graphic source:https://www.cell.com/cell/fulltext/S0092-8674(23)00796-1
Graphic source: https://journals.physiology.org/doi/epdf/10.1152/ajpcell.00224.2020
Mechanism of immune competence, tolerance, and immunopathology toward SARS-CoV-2 infection in different hosts and clinical scenarios. ADE, antibody-dependent enhancement; CNI, calcineurin inhibitors; CTL, cytotoxic T cell; CD71+ EC, CD71+ erythroid precursors; EC, lung epithelial cell; KD, Kawasaki disease; MDSC, myeloid-derived suppressor cells; Mϕ, macrophage; MIS-C, Multisystem Inflammatory Syndrome in Children; PRR, Pattern Recognition Receptor; TLR, Toll-like receptors.
Graphic source: https://www.frontiersin.org/articles/10.3389/fped.2021.629240/full
Graphic source: https://www.nature.com/articles/s41401-022-00998-0#Fig2
VIDEO
Graphic source: https://www.vox.com/science-and-health/22586816/next-coronavirus-variant-delta-covid-19
Graphic source: https://www.nature.com/articles/s41564-020-0709-x.pdf
Graphic source: https://www.nature.com/articles/s41564-020-0709-x.pdf
Graphic source: https://www.nature.com/articles/d41586-021-01749-7
Graphic source: https://www.nature.com/articles/d41586-021-01749-7
Graphic source: https://www.nature.com/articles/d41586-021-01749-7
Graphic source: https://www.nature.com/articles/s41564-020-0695-z
Recent pandemic viruses, including SAR-CoV-2, spread directly to people without adaptation, researchers say CIDRAP, 3/2026 Four ways COVID changed virology: lessons from the most sequenced virus of all time
After 150,000 articles and 17 million genome sequences, what has science taught us about SARS-CoV-2? 3/12/2025 COVID-19
10/2023 Annals of Internal Medicine Beyond coronavirus: the virus discoveries transforming biology, SARS-CoV-2 is just one of nonillions of viruses on our planet, and scientists are rapidly identifying legions of new species. 6/2021 COVID-19 in Immunosuppressed Children 4/2021 Decoding SARS-CoV-2 hijacking of host mitochondria in COVID-19pathogenesis 6/2020 Endothelial dysfunction in COVID-19: an overview of evidence, biomarkers, mechanisms and potential therapies 10/2022 Epigenetic memory of coronavirus infection in innate immune cells and their progenitors 8/2023 Cell.com Genomics and Virology Genome.gov Large COVID autopsy study finds SARS-CoV-2 all over the human body 1/2023
New clues to how COVID may trigger immune damage in the brain 7/2022 NIAID Pandemic Autopsy Study Fosters Long COVID Treatment Trial 12/2022
SARS-CoV-2 infection and persistence in the human body and brain at autopsy 12/2022 SARS-CoV-2 rebound and post-acute mortality and hospitalization among patients admitted with COVID-19: cohort study 7/2025 Scientists discover receptor that blocks COVID-19 infection. The receptor sticks to the virus and pulls it away from the target cells LRRC15 2/2023 Stanford study finds inflammation in brains of deceased COVID-19 patients 6/2021 The new scope of virus taxonomy: partitioning the virosphere into 15 hierarchical ranks 5/2020 The species Severe acute respiratory syndrome-related coronavirus: classifying 2019-nCoV and naming it SARS-CoV-2 3/20202 Nature.com Viral afterlife: SARS-CoV-2 as a reservoir of immunomimetic peptides that reassemble into proinflammatory supramolecular complexes 2/2024
COVID-19 Metrics
Graphic source: https://www.propublica.org/article/how-to-understand-covid-19-numbers
Graphic source: https://www.propublica.org/article/how-to-understand-covid-19-numbers
Graphic source: https://www.propublica.org/article/how-to-understand-covid-19-numbers
Graphic source: https://www.propublica.org/article/how-to-understand-covid-19-numbers
Graphic source: https://globalepidemics.org/wp-content/uploads/2020/06/key_metrics_and_indicators_v4.pdf
Graphic source: https://globalepidemics.org/wp-content/uploads/2020/06/key_metrics_and_indicators_v4.pdf
Graphic source: https://globalepidemics.org/wp-content/uploads/2020/06/key_metrics_and_indicators_v4.pdf
Graphic source: https://globalepidemics.org/wp-content/uploads/2020/06/key_metrics_and_indicators_v4.pdf
Graphic source: https://globalepidemics.org/wp-content/uploads/2020/06/key_metrics_and_indicators_v4.pdf
Back to Table of Contents
COVID-19 CDC Surveillance
COVID-19 Dust Surveillance
COVID-19 Genomic Surveillance
Graphic source: https://www.cdc.gov/respiratory-viruses/whats-new/variants-happen.html
COVID-19 Hotspot Surveillance
4th Surge
Graphic source: TIME
Graphic source: https://directorsblog.nih.gov/2021/06/24/new-metric-identifies-coronavirus-hotspots-in-real-time/
Graphic source: https://science.sciencemag.org/content/early/2021/06/02/science.abh0635
Graphic source: https://science.sciencemag.org/content/early/2021/06/02/science.abh0635
Graphic source: https://science.sciencemag.org/content/early/2021/06/02/science.abh0635
Graphic source: https://science.sciencemag.org/content/early/2021/06/02/science.abh0635
Graphic source: https://www.nytimes.com/interactive/2020/world/coronavirus-maps.html
Graphic source: https://www.sciencedirect.com/science/article/pii/S1877584520300320
Graphic source: https://www.sciencedirect.com/science/article/pii/S1877584520300320
COVID-19 Ocean Surveillance
Graphic source: https://www.sciencedirect.com/science/article/pii/S0048969723059703
COVID-19 Travel-based Genomic Surveillance
Graphic source: https://wwwnc.cdc.gov/travel/page/travel-genomic-surveillance
COVID-19 Wastewater Surveillance
July 23, 2024 - Status of Wasterwater Surveillance
Graphic source: https://thesicktimes.org/2024/07/23/wastewater-surveillance-for-covid-19-keeps-evolving-heres-what-you-need-to-know/
Graphic source: https://www.cidrap.umn.edu/avian-influenza-bird-flu/h5n1-avian-flu-silently-spreading-us-cattle-wastewater-testing-could-be
Graphic source: https://www.sciencenews.org/article/sewage-key-track-disease-covid-19-wastewater
Graphic source: https://wastewater.covidsurge.mathematica.org/
Graphic source: https://www.sciencedirect.com/science/article/pii/S0048969720352402?via%3Dihub
Graphic source: https://www.gao.gov/products/gao-22-105841
Graphic source: https://www.gao.gov/products/gao-22-105841
COVID-19 National Wastewater Data CDC.gov Wastewater COVID-19 State and Territory Trends CDC.gov COVID-19 Variants in Wastewater CDC.gov Wastewater testing predicts community COVID cases, experts say 5/2025 Wastewater surveillance for Covid-19 keeps evolving. Here’s what you need to know. 7/2024 Wastewater COVID-19 National and Regional Trends. COVID-19 NWSS Wastewater Monitoring in the U.S.
Colorado COVID Wastewater Monitoring Data Trends Covid-SURGE (Signaling Unprecedented Rises in Groupwide Exposure) toolkit to 8/2023 Mathematica.org Wastewater Surveillance in the U.S. COVID-19: Wastewater Surveillance CDC.gov Biobot Network of Wastewater Treatment Plants COVIDPoops19 Summary of Global SARS-CoV-2 Wastewater Monitoring Efforts by UC Merced Researchers WastewaterSCAN Dashboard
Integrating Wastewater and Public Health Data 12/2022 The Biobot Network of Wastewater Treatment Plants
U.S. Centers for Disease Control and Prevention Selects Biobot Analytics to Expand National Wastewater Monitoring 5/2022 Coronavirus found in samples from 96% of flights 1/2023 Science & Tech Spotlight: Wastewater Surveillance GAO.gov 4/2022 Breakthrough in detection of SARS-CoV-2 variant in wastewater 7/2021 CDC wants to monitor poop: States aren’t all on board. Wastewater surveillance gained popularity during the pandemic as state and local health officials demonstrated how they could detect the coronavirus in their community’s sewage systems before residents developed symptoms. 3/2022 Coronavirus was already in Italy by December, waste water study shows 6/2020 Early warning system for COVID-19 gets faster through wastewater detection and tracing 6/2021 Explainer: Wastewater. How does wastewater testing work? 3/2021 High levels of COVID-19 have been found in Florida sewage, but a local spill hasn't been tested 7/2020 How sewage can warn us about the next pandemic. The ins and outs of wastewater surveillance. 4/2022 How the University of Arizona used No. 2 to solve its No. 1 problem: The coronavirus. The university made a bold claim this week: It stopped a coronavirus outbreak before it started. 8/2020
Multi-virus wastewater surveillance shows promise at smaller, site-specific scales. Study suggests onsite monitoring at buildings or complexes could aid efforts against disease spread. 4/2025 New research examines wastewater to detect community spread of Covid-19 4/2020 Statnews SARS-CoV-2 has been circulating in northern Italy since December 2019: Evidence from environmental monitoring 1/2021 SARS-CoV-2 RNA Levels in Wastewater in the United States CDC.gov 2/2022 Separating signal from noise in wastewater data: An algorithm to identify community-level COVID-19 surges in real time Sewage Data Added to CDC's COVID Tracker for Early Surge Warnings - Hundreds more wastewater detection sites to add data soon 2/2022 Sewage Systems Surveillance for SARS-CoV-2: Identification of Knowledge Gaps, Emerging Threats, and Future Research Needs 7/2021 Sewage Testing on University Campus Identifies Asymptomatic Covid Cases 8/2020 Sewer slime can hang on to SARS-CoV-2 RNA from wastewater 2/2022 The fast-spreading coronavirus variant is turning up in US sewers. The toilet flushes of millions of people can track the rise of dangerous new strains of the covid-19 virus. 2/2021 The myriad ways sewage surveillance is helping fight COVID around the world 5/2021. Wastewater tracking was used before the pandemic to monitor for polio and illicit drug use, but interest in the field and its applications has now ballooned. These scientists traced a new coronavirus lineage to one office — through sewage. Researchers are hunting through waste water for heavily mutated SARS-CoV-2 variants that could be the next Omicron. 9/2022 The Straight Poop on Tracking COVID-19 in Communities. More evidence for wastewater as another epidemiological tool to monitor outbreaks 9/2020 The proof is in the sewage: hundreds of Yosemite visitors may have had coronavirus. 7/2020. No one had tested positive via nasal swabs, but researchers' investigation tells a different story Tracking cryptic SARS-CoV-2 lineages detected in NYC wastewater 2/2022 Nature.com Tracking SARS-CoV-2 during Tokyo 2020 via wastewater 2/2022 University Of Arizona Prevented Coronavirus Outbreak On Campus By Testing Wastewater 8/2020 Use of Wastewater Metrics to Track COVID-19 in the US 7/2023 JAMA Using Wastewater Surveillance Data to Support the COVID-19 Response - United States, 2020-2021 9/2021 MMWR Wastewater could provide up to a week of warning for a COVID-19 spike. Finding coronavirus RNA in sewage may signal that people in a community are infected 5/2020 Wastewater Data FAQs 6/2023 Wastewater Monitoring for Public Health 2/2022 Wastewater provides a planet-wide laboratory for the study of human health 4/2022 Wastewater samples reveal record levels of coronavirus across U.S. "Wastewater is going to be a leading indicator for what's going on in a given community and what's to come," said a senior scholar at the Johns Hopkins Center for Health Security. 1/2022 Wastewater sampling in Canada suggests COVID case rate 19 times higher than reported 6/2023 Wastewater surveillance may be best marker of community COVID-19 prevalence 7/2023 Wastewater testing gains traction as a Covid-19 early warning system 5/2020 Statnews Wastewater testing near homeless camps shows COVID-19 viral mutations 4/2024 What’s standing in the way of wastewater data becoming a more mainstream public health tool 1/2023 Why sewage may hold the key to tracking diseases far beyond COVID-19. A rapidly growing list of pathogens are detectable in wastewater 9/2023
Back to Table of Contents
COVID-19 Outbreak
Graphic source: https://www.nbcnews.com/health/health-news/covid-cases-deaths-rising-u-s-cdc-warns-pandemic-unvaccinated-n1274161
Graphic source: https://www.nytimes.com/interactive/2021/world/covid-cases.html
Graphic source: https://www.nytimes.com/interactive/2020/world/coronavirus-maps.html
Graphic source: https://www.vox.com/2020/11/8/21550345/50-million-confirmed-cases-covid-19-worldwide
Graphic source: https://www.vox.com/2020/11/8/21550345/50-million-confirmed-cases-covid-19-worldwide
Epidemic curve of daily cases of laboratory-confirmed SARS-CoV-2 infection in Hong Kong by symptom onset date and colored by cluster category (n=1,038).
Graphic source: https://www.nature.com/articles/s41591-020-1092-0/figures/1
Graphic source: https://www.cdc.gov/mmwr/volumes/69/wr/mm6922e1.htm
Timeline Comparing the Severe Acute Respiratory Syndrome (SARS) and Coronavirus Disease 2019 (COVID-19) Outbreaks
Graphic source: https://jamanetwork.com/journals/jama/fullarticle/2762130
Graphic Source: NY Times Graphic, via @FelicityCarus #MackayIM
Back to Table of Contents
COVID-19 Outbreak Trends
How COVID-19 Has Shifted Over Time
Graphic source: https://www.npr.org/sections/goatsandsoda/2020/03/30/822491838/coronavirus-world-map-tracking-the-spread-of-the-outbreak
What Previous Covid-19 Waves Tell Us About the Virus Now (October, 2021)
Graphic source: https://www.nytimes.com/interactive/2021/10/23/us/covid-surges.html
July-August 2021 - Delta Variant Running Rampant in the U.S.
Graphic source: CNN
Graphic source: https://www.usatoday.com/in-depth/graphics/2020/03/10/us-coronavirus-map-tracking-united-states-outbreak/4945223002/
Graphic source: https://www.npr.org/sections/goatsandsoda/2020/03/30/822491838/coronavirus-world-map-tracking-the-spread-of-the-outbreak
Map source: CDC
Video source: https://www.vox.com/future-perfect/21353986/coronavirus-covid-pandemic-usa-america-maps-charts-data
July 7, 2021
Graphic source: https://www.nbcnews.com/health/health-news/coronavirus-map-confirmed-cases-2020-n1120686
July 7, 201
Graphic source: https://www.nbcnews.com/health/health-news/coronavirus-map-confirmed-cases-2020-n1120686
Graphic source:
https://www.npr.org/sections/goatsandsoda/2020/03/30/822491838/coronavirus-world-map-tracking-the-spread-of-the-outbreak
Graphic source: https://www.cnn.com/2020/09/28/health/coronavirus-million-global-deaths-intl/index.html
Graphic source: https://www.cdc.gov/mmwr/volumes/69/wr/mm6939e1.htm
Graphic source: https://www.cdc.gov/mmwr/volumes/69/wr/mm6939e1.htm
Graphic source:
https://www.statista.com/chart/20651/locations-by-number-of-confirmed-wuhan-coronavirus-cases/
Graphic source: https://www.brookings.edu/2020/04/02/the-early-days-of-a-global-pandemic-a-timeline-of-covid-19-spread-and-government-interventions/
Graphic source; https://twitter.com/bettycjung/status/1282357711703887872
Graphic source: https://www.pressherald.com/2020/07/05/how-the-geography-of-the-pandemic-is-determined-by-centuries-old-regional-differences/
Graphic source:
https://www.washingtonpost.com/politics/2020/06/18/trump-claims-coronavirus-pandemic-is-ending-data-experts-disagree/
Graphic source: https://www.mckinsey.com/~/media/McKinsey/Business%20Functions/Risk/Our%20Insights/COVID%2019%20Implications%20for%20business/COVID%2019%20May%2027/COVID-19-Facts-and-Insights-June-1-vF.ashx
Percentage of emergency department (ED) visits for COVID-19-like illness (CLI), in 14 counties (three in California and Washington [A]; four in Illinois, Louisiana, Massachusetts, and Michigan [B]; and seven in New York [C]) -National Syndromic Surveillance System, February 1-April 7, 2020
Graphic source: https://www.cdc.gov/mmwr/volumes/69/wr/mm6922e1.htm
Graphic source: https://www.cnbc.com/2020/05/21/global-coronavirus-cases-surpass-5-million-johns-hopkins-data-shows.html
Graphic source: https://twitter.com/EricTopol/status/1260659915816792064
Graphic source: https://twitter.com/yaneerbaryam/status/1256769252369072134
Graphic source: https://www.webmd.com/lung/news/20200424/more-data-bolsters-higher-covid-prevalence
Graphic source: https://www.wsj.com/articles/u-s-coronavirus-cases-top-1-000-11583917794
Graphic source: https://www.cdc.gov/mmwr/volumes/69/wr/mm6933e2.htm
FIGURE 1. Number of COVID-19 hotspot alerts, by county and number of days* meeting hotspot criteria for (A) March 8-April 30, (B) May 1-31, (C) June 1-July 15, and (D) entire period - United States, March 8-July 15, 2020
Map source: https://www.cdc.gov/mmwr/volumes/69/wr/mm6933e2.htm
FIGURE 2. Daily number of COVID-19 hotspot alerts, by urbanicity, and 7-day average of new reported cases - United States, March 8-July 15, 2020
Graphic source: https://www.cdc.gov/mmwr/volumes/69/wr/mm6933e2.htm
5 ways to prevent another 100,000 coronavirus deaths in the US (and beyond) 5/2020 It's time to fix the glaring gaps in death data and drastically improve measures to keep the coronavirus out of nursing homes. Burden and characteristics of COVID-19 in the United States during 2020 8/2021 Coronavirus Epidemics Began Later Than Believed, Study Concludes 5/27/2020 Coronavirus World Map: We've Now Passed The 200 Million Mark For Infections 11/2021 Covid-19, a disease with tricks up its sleeve, hasn’t fallen into a seasonal pattern — yet 9/2023 Covid-19 cases are falling in the U.S. It could be a calm before a variant-driven storm 2/2021 COVID-19 spikes in South Africa, Melbourne offer America clues ahead of winter 2020. Will the U.S., which has so far failed repeatedly to get ahead of COVID-19's spread, start paying attention in time? 8/2020 Does COVID-19 Persist? - An unexpected idea gains traction and may provide clues about long COVID 5/20/2024 The early days of a global pandemic: A timeline of COVID-19 spread and government interventions Evidence Mounts for Greater COVID Prevalence 4/2020 Four ways COVID changed virology: lessons from the most sequenced virus of all time
After 150,000 articles and 17 million genome sequences, what has science taught us about SARS-CoV-2? 3/12/2025 How the Virus Won 6/2020 Geographic Differences in COVID-19 Cases, Deaths, and Incidence - United States, February 12-April 7, 2020 MMWR 4/2020 How the geography of the pandemic is determined by centuries-old regional differences 7/2020. Analysis: Fundamental differences in the balance between individual liberty and the common good are reflected in COVID-19 trends. 'It was hell': How Covid-19 surges played out season by season
The virus came in waves, creating scenes of lockdowns in one state while beaches remained open in another. 3/2021 6/2020. Time Most Americans have now had Covid-19 – but experts are predicting the next surge 5/2022 Nowcasting and forecasting the potential domestic and international spread of the 2019-nCoV outbreak originating in Wuhan, China: a modelling study 1/2020 The U.S. Has Officially Unflattened the Curve With Its Worst Day of the Coronavirus Pandemic Yet 6/2020 'This Day Was Bound to Come': Taiwan Confronts a Covid Flare-Up. The island's border controls had shielded it from the worst of the pandemic. But new variants and a slow vaccine rollout gave the virus an opening. 5/2021
Trends in Number and Distribution of COVID-19 Hotspot Counties-United States, March 8-July 15, 2020 8/2020 Virus Cases Surged in Young Adults. The Elderly Were Hit Next. 9/2020 What Previous Covid-19 Waves Tell Us About the Virus Now 10/2021 Younger Adults Caught in COVID-19 Crosshairs as Demographics Shift 11/2020
Back to Table of Contents
The Search for Patient Zero
NIH Freedom from Science Lecture Series-2026 March, 2026
VIDEO
December 1, 2019: First Case of COVID-19 Appeared in Wuhan | FRewind
Wuhan: How the COVID-19 Outbreak in China Spiraled Out of Control
VIDEO
December 29, 2022: 3 years ago today: An 'urgent notice' from the Wuhan Health Commission warns doctors about an unidentified illness in the city. The internal notice is later shared on social media, making it the first word of the COVID-19 outbreak
VIDEO
Graphic source: https://twitter.com/BNOFeed/status/1608602603268571137
First documented case (11/17/2019)
Graphic: https://www.smh.com.au/world/asia/china-s-top-secret-search-for-the-origins-of-coronavirus-20210102-p56rar.html
Map Source: https://journals.plos.org/plospathogens/article?id=10.1371/journal.ppat.1009620
Continual search for Patient Zero - Worobey's Research
VIDEO
September 19, 2024
Graphic source: https://www.cell.com/cell/fulltext/S0092-8674(24)00901-2?_returnURL=https%3A%2F%2Flinkinghub.elsevier.com%2Fretrieve%2Fpii%2FS0092867424009012%3Fshowall%3Dtrue
Where samples positive for the coronavirus were found in Huanan Seafood Wholesale Market in January 2020
Graphic source: https://www.npr.org/sections/goatsandsoda/2022/03/03/1083751272/striking-new-evidence-points-to-seafood-market-in-wuhan-as-pandemic-origin-point
Mapping the first reported cases of COVID-19 in Wuhan
Graphic source: https://www.npr.org/sections/goatsandsoda/2022/03/03/1083751272/striking-new-evidence-points-to-seafood-market-in-wuhan-as-pandemic-origin-point
Researchers detected more SARS-CoV-2 in the environment around specific live animal sellers at the Huanan Wholesale Seafood Market in Wuhan, China. Worobey et al./Zenodo.org
Map source: https://www.vox.com/22961822/covid-19-origin-coronavirus-wuhan-china-market-lab-leak
Worobey - Huanan Market
Graphic source: https://www.npr.org/sections/goatsandsoda/2022/03/03/1083751272/striking-new-evidence-points-to-seafood-market-in-wuhan-as-pandemic-origin-point
Worobey - First Reported Cases
Graphic source: https://www.npr.org/sections/goatsandsoda/2022/03/03/1083751272/striking-new-evidence-points-to-seafood-market-in-wuhan-as-pandemic-origin-point
Worobey's Timeline for initial human contact
Graphic source: https://twitter.com/angie_rasmussen/status/1497692666997329923
Worobey's Spillovers
Graphic source: https://zenodo.org/record/6299116#.YhpLBi9h06w
Worobey's summary graphics
Graphic source: https://twitter.com/danwalker9999/status/1461591621749772292
Map source: https://www.npr.org/sections/goatsandsoda/2021/07/19/1016005828/new-data-leads-to-rethinking-once-more-where-the-pandemic-actually-began
Continual search for Patient Zero and Origin - Other Leads
Graphic source:
https://www.nejm.org/doi/full/10.1056/NEJMp2305081
COVID's origins: what we do and don't know. Researchers summarize key insights from the world's first comprehensive investigation into how a pandemic started. Nature.com, 2/24/2026 Animal Source Most Likely Origin of SARS-CoV2 but Missing Chinese Data Leave Findings Inconclusive: WHO Expert Group 6/27/2025 Independent assessment of the origins of SARS‑CoV‑2. Developed by the Scientific Advisory Group for the Origins of Novel Pathogens (SAGO) 6/27/2025 WHO expert group fails to find a definitive answer for how Covid-19 began 6/2025 Wuhan lab samples hold no close relatives to virus behind COVID.Shi Zhengli, the virologist at centre of COVID lab-leak theory, reveals coronavirus sequences from Wuhan institute. 12/6/2024. Nature.com US had COVID sequence in 2019, raising questions about who knew what when 1/2024 USAToday The Origins of Covid-19 — Why It Matters (and Why It Doesn’t) 6/2023 NEJM.org An Evolutionary Perspective on Why the Lab Leak Theory Is Wrong
— It's the initial outbreak that tells us what we need to know 6/2023 "A Complex and Grave Situation" A Political Chronology of the SARS-COV-2 Outbreak 5/2023 US Senate China must share data on COVID-19's origins 'immediately,' WHO scientist demands; The World Health Organization's COVID-19 technical lead is calling for China to release all its data related to the pandemic's origins. 4/2023 Beijing ordered destruction of early coronavirus samples, secret memo shows 6/2023 Origin of COVID-19: Dismissing the Mojiang mine theory and the laboratory accident narrative 9/2021 Share all SARS-CoV-2 data immediately 4/2023 Science.org 7 facts about the origin of the novel coronavirus 7/2021 Amid Signs Coronavirus Came Earlier, Americans Ask: Did I Already Have It? 4/2020 Autopsies reveal first confirmed U.S. coronavirus deaths occurred in California in February 4/2020 Biden asks intelligence community to 'redouble' efforts to determine the origins of Covid-19. "I have now asked the Intelligence Community to redouble their efforts to collect and analyze information that could bring us closer to a definitive conclusion, and to report back to me in 90 days," the statement said. 5/2021 Biosafety expert close to Wuhan Institute of Virology urged associates there to address his tough questions about lab origin of SARS-CoV-2 12/2021 Biosecurity Incident in Wuhan 11/2022 C.D.C. Confirms First Possible Community Transmission of Coronavirus in U.S. - A case in California may be the first infection without a known link to travel abroad. 3/2020 Chances of finding COVID-virus ancestor ‘almost nil’, say virologists. Genome analysis finds SARS-CoV-2 and bat coronaviruses shared an ancestor just a few years ago, but extensive recombination has muddied the picture. 11/2022 NatureBriefing.com China delayed releasing coronavirus info, frustrating WHO AP News 2/2020 China refused to provide WHO team with raw data on early COVID cases, team member says 2/2021 China to test thousands of Wuhan blood samples in Covid-19 probe 10/2021 Chinese Censorship Is Quietly Rewriting the Covid-19 Story 4/2023 Coronavirus Was In U.S. Weeks Earlier Than Previously Known, Study Says 12/2020 COVID-19 Appeared in Boy in Italy in November 2019 12/2020 COVID-19 Origins: Investigating a “Complex and Grave Situation” Inside a Wuhan Lab. The Wuhan lab at the center of suspicions about the pandemic’s onset was far more troubled than known, documents unearthed by a Senate team reveal. Tracing the evidence, Vanity Fair and ProPublica give the clearest view yet of a biocomplex in crisis. 10/2022
Seven days after the Zhengdian party branch members wrote their memo about rushing to the front line to defend against viral dangers, fallout arrived in the form of an official visitor from Beijing. That visitor, Dr. Ji Changzheng, is the technology safety and security director for the Chinese Academy of Sciences, the sprawling state agency that oversees more than 100 research institutions in China, including the WIV. His visit was billed as a senior safety-training seminar for a small high-level audience, including the WIV’s research department heads and top biosafety officials.
COVID-19 Origins: Investigating a “Complex and Grave Situation” Inside a Wuhan Lab
The Wuhan lab at the center of suspicions about the pandemic’s onset was far more troubled than known, documents unearthed by a Senate team reveal. Tracing the evidence, Vanity Fair and ProPublica give the clearest view yet of a biocomplex in crisis. 10/2022 COVID-origins study links raccoon dogs to Wuhan market: what scientists think
Some scientists say the analysis provides new evidence supporting the hypothesis that the virus that causes COVID-19 spilled over from an animal — but falls short of definitive proof. 3/2023 Dissecting the early COVID-19 cases in Wuhan 11/2021 Explainer: The WHO's theories about the origins of COVID-19 after Wuhan probe 2/2021 First Known Covid Case Was Vendor at Wuhan Market, Scientist Claims. A new review of early Covid-19 cases in the journal Science will revive, though certainly not settle, the debate over how the pandemic began. 11/2021 NY Times G7 leaders will call for fresh WHO inquiry into Covid origins, leaked communique suggests 6/2021 National-Health-Commission-Notice-to-Labs-Jan-3-English 6/2023 Intel agencies scour reams of genetic data from Wuhan lab in Covid origins hunt 8/2021 Intelligence on Sick Staff at Wuhan Lab Fuels Debate on Covid-19 Origin. Report says researchers went to hospital in November 2019, shortly before confirmed outbreak; adds to calls for probe of whether virus escaped lab 5/2021 Investigate the origins of COVID-19 5/2021 Labs (in Chinese USRTK.org 6/2023 Leading scientist says that without a full investigation of lab leak theory, the world will face 'covid-26 and covid-32' 6/2021 New Data Leads To Rethinking (Once More) Where The Pandemic Actually Began 7/2021 NIH researchers find more evidence Covid was circulating in the US in December 2019 6/2021 Novel Coronavirus Circulated Undetected Months before First COVID-19 Cases in Wuhan, China. Study dates emergence to as early as October 2019; simulations suggest in most cases zoonotic viruses die out naturally before causing a pandemic 3/2021 Potential Links Between the Wuhan Institute of Virology and the Origin of the COVID-19 Pandemic 6/2023 Office of the Director of National Intelligence
Preliminary Report for the Scientific Advisory Group for the Origins of Novel Pathogens (SAGO) 6/2022 WHO.int Scientific Advisory Group for the Origins of Novel Pathogens (SAGO) Preliminary Report of the SAGO 9 June 2022 Version 1 received 13 April 2022 by WHO Version 2 received 15 May 2022 by WHO *This version includes a timeline, letters to WHO from the SAGO, and clarifications requested by WHO." PDF Recovery of deleted deep sequencing data sheds more light on the early Wuhan SARS-CoV-2 epidemic 6/2021 Search Continues for COVID Patient Zero 7/2021 Senate GOP Covid origins probe finds circumstantial evidence but no ‘smoking gun’ to support lab leak theory 5/2023 Senate HELP Committee Minority Oversight Staff Releases Interim Report Analyzing Origins of COVID-19 Pandemic 10/27/2022 An Analysis of the Origins of the COVID19 Pandemic Interim Report Senate Committee on Health Education, Labor and Pensions Minority Oversight Staff October 2022 10/27/2022
Serologic Testing of US Blood Donations to Identify Severe Acute Respiratory Syndrome Coronavirus 2 (SARS-CoV-2)-Reactive Antibodies: December 2019–January 2020 6/2021 Surveillance of SARS-CoV-2 at the Huanan Seafood Market 4/2023 Nature.com The coronavirus may have reached Los Angeles even before China announced its outbreak 9/2020 1st U.S. coronavirus death was weeks earlier than initially believed Two previously unreported cases from February in California appear to be the nation's first confirmed deaths from COVID-19. 4/2020 Coronavirus: France's first known case was in December 5/2020 COVID-origins report sparks debate over major genome hub GISAID
GISAID revoked researchers’ access following the report, sparking discussion about findings based on data found in online repositories. 3/2023 France Discovers Undiagnosed Coronavirus Patient From Last Year 5/2020 French Doctors Find COVID-19 Case From December - A Month Before 1st Known Case There 5/2020 From Wuhan to Paris to Milan, the search for 'patient zero' 7/2021 Inside the Global Quest to Trace the Origins of COVID-19 and Predict Where It Will Go Next
Time 7/2020 Newly published evidence points to Wuhan seafood market as pandemic origin point 7/2022 New Report Says Coronavirus May Have Made Early Appearance in France 5/2020 New York area's 'patient zero' says coronavirus 'wasn't on my mind' when he got sick 5/2020 'Patient zero': The misunderstood stories of how disease spreads 11/2016 Study Suggests Coronavirus Emerged Much Earlier Than Thought. Some Are Skeptical. 6/2020 The Legal Stakes of a Lab Leak - China could be on the hook for a trillion dollars, but the U.S. isn't blameless 6/2021 The molecular epidemiology of multiple zoonotic origins of SARS-CoV-2 7/2022 The Mysterious Case of the COVID-19 Lab-Leak Theory 10/2021 The Occam's Razor Argument Has Not Shifted in Favor of a Lab Leak 7/2021. Proponents of the theory that COVID-19 originated as a result of work performed at the Wuhan Institute of Virology keep repeating the same misinformation. The Origins of SARS-CoV-2: A Critical Review Pre-print 8/2021
The Origins of SARS-CoV-2: A Critical Review Peer-reviewed 8/2021 The science around the lab leak theory hasn't changed. But here's why some scientists have. Five virologists said few conclusions can be drawn based on the available scientific evidence, but they noted that the context and circumstances of the debate have changed. 6/2021
Top U.S. health official calls for 'transparent' new probe into origins of pandemic. The comments come after a U.S. intelligence report said lab workers in Wuhan, China, fell ill in November 2019, before the first cases were reported. 5/2021 Trump's gone, but China, U.S. still at odds over WHO Covid report. "It's kind of disappointing that it's come to controversy already - the report is not even out," one of the members of the WHO-led team said. Unclassified Summary of Assessment on COVID-19 Origins DNI.gov 9/2021 Undiagnosed Pneumonia - 2019 Promed E-mails 6/2023 Updated Assessment on COVID-19 Origins US Intelligence community releases full declassified report that does not determine origin of Covid-19 10/2021 U.S. Intelligence Agencies May Never Find Covid’s Origins, Officials Say 6/2023 U.S. intel officials divided over whether Covid came from China lab accident. One U.S. agency says with moderate confidence the virus infected humans after a lab incident, but four others say with low confidence it emerged naturally. 8/2021 U.S. intel report identified 3 Wuhan lab researchers who fell ill in November 2019 5/2021 The details add to circumstantial evidence supporting a theory Covid-19 spread to humans after escaping from a lab. But the evidence is far from conclusive. U.S.-China relationship, good news with the bad amid public health response to new virus outbreak [Opinion] 1/2020 U.S. still hasn't ruled out lab accident origin for Covid because China hasn't been transparent. U.S. officials haven't shown any evidence pointing to a lab escape, and scientists call the scenario unlikely. The U.S. wants China to share information. 2/2021 What does the science say about the origin of the SARS-CoV-2 pandemic? 2/2023 NPR.org ‘What would Jim do?’: U.S. virologist close to Wuhan lab quietly called for investigation 3/2022 When Did the Coronavirus Arrive in the U.S.? Here's a Review of the Evidence. 5/2020 WHO calls on China to share data on raccoon dog link to pandemic. Here's what we know 3/2023 WHO in Wuhan is probing Covid's origins as politics hangs over mission. "The objective of the investigation is not to designate a guilty country," one expert said. "But we also have to be realistic: This is a very politicized world." 1/2021 Why it's so tricky to trace the origin of COVID-19. A 90-day investigation into the source of SARS-CoV-2 has shown consensus that the virus was not engineered. But many other elements remain a mystery. 9/2021 Why it will soon be too late to find out where COVID-19 originated. Time is running out to identify the source of the SARS-CoV-2 outbreak 20 months ago 8/2021 Will we ever find COVID-19's 'Patient Zero?' A lack of transparency on the virus' early days makes for an uphill battle. 7/2021 Wuhan lab and web of Chinese red tape that delayed US scientists getting access to coronavirus 9/2021 Wuhan lab samples hold no close relatives to virus behind COVID
Shi Zhengli, the virologist at centre of COVID lab-leak theory, reveals coronavirus sequences from Wuhan institute. 12/9/2024 Wuhan lab can delete data in ‘explosive’ legal agreement with U.S. lab 4/2022
Back to Table of Contents
Lab Leak Origins (Contested)
All graphics from Five Reasons Why It Still Wasn't a Lab Leak
Time for some of that civil disagreement that the NIH Director can't get enough of RasmussenRetorts, March 30, 2026
VIDEO
Back to Table of Contents
Zoonotic Origins
Graphic source: https://gumc.georgetown.edu/news-release/new-study-finds-climate-change-could-spark-the-next-pandemic/#
Relationship of bat coronaviruses to SARS-CoV-1 and SARS-CoV-2.
Graphic source: https://www.niaid.nih.gov/diseases-conditions/coronavirus-bat-research
Comparison of the nucleotide sequence identity of indicated coronaviruses to SARS-CoV-2.
Graphic source: https://www.niaid.nih.gov/diseases-conditions/coronavirus-bat-research
Graphic source: https://www.who.int/docs/default-source/coronaviruse/who-convened-global-study-of-originI>
African Swine Fever Virus: A Global Concern 4/2022 Animal source of the coronavirus continues to elude scientists 5/2020
Bats and pangolins in Southeast Asia harbour SARS-CoV-2-related coronaviruses, reveals new study 2/2021 Bats & pangolins in Southeast Asia harbour SARS-CoV-2-related coronaviruses, reveals new study 2/2021 Bat Coronaviruses in China 3/2019 Bats offer clues to treating COVID-19 7/2020. To combat COVID-19, we need to regulate our immune systems to resemble those of bats Bat origin of human coronaviruses 2015 Bat 'super immunity' may explain how bats carry coronaviruses, study finds. Bat-virus adaptation may explain species spillover, researchers say 5/2020 Bats Harbor Hundreds Of Coronaviruses, And Spillovers Aren't Rare 2/2020 COVID-19 coronavirus epidemic has a natural origin 3/2020 COVID-19 highlights risks of wildlife trade 11/2020 COVID-19 Is Mutating In Deer. That Could Become a Problem for People 9/2023 Time.com Did a new coronavirus go from dog to human? 5/2021 Dutch Minks Contract COVID-19 And Appear To Infect Humans 6/2020 Evolutionary history, potential intermediate animal host, and cross-species analyses of SARS-CoV-2 2/2020 Evolution of pandemic coronavirus outlines path from animals to humans 5/2020 The virus's ability to change makes it likely that new human coronaviruses will arise From Bats to Human Lungs, the Evolution of a Coronavirus 3/2020
Genomic analysis reveals many animal species may be vulnerable to SARS-CoV-2 infection 8/2020 Global report: Wuhan lab says its bat strains were not Covid-19 as US nears 100,000 deaths 5/2020 How Humanity Unleashed a Flood of New Diseases 6/2020 How SARS-CoV-2 in American deer could alter the course of the global pandemic 11/2021 How WHO is working to track down the animal reservoir of the SARS-CoV-2 virus 11/2020 Inside the Global Quest to Trace the Origins of COVID-19 and Predict Where It Will Go Next Time 7/2020 It's Much More Likely the Coronavirus Came from Wildlife, Not a Lab 4/2021 New coronavirus can spread between humans but it started in a wildlife market 1/2020 New Coronavirus Detected In Patients At Malaysian Hospital; The Source May Be Dogs 5/2021 New Study Finds Climate Change Could Spark the Next Pandemic 5/2022 Next Pandemic: Scientists Fear Another Coronavirus Could Jump From Animals To Humans 3/2021 Novel coronavirus may have been transmitted to humans from snakes 1/2020 (Controversial) Newly emerged coronavirus did not spill over from scaly anteaters, researchers say 5/2020 Origin and cross-species transmission of bat coronaviruses in China 6/2020 Preventing the next pandemic - Zoonotic diseases and how to break the chain of transmission U.N. Report 7/2020 Researchers trace coronavirus outbreak in China to snakes 1/2020 (Controversial, just including it for the sake of completeness) SARS-CoV-2 and NIAID-supported Bat Coronavirus Research 10/2021 SARS-CoV-2 jumped from bats to humans without much change, study finds 3/2021 SARS-CoV-2 looks like a hybrid of viruses from two different species 6/2020 Pieces of several genomes recombined to produce the pandemic-causing pathogen. SARS-CoV-2 relative found lurking in frozen bats from Cambodia 11/2020 SARS-CoV-2 Viral Mutations: Impact on COVID-19 Tests FDA.gov Team pinpoints the origin story of SARS-CoV-2 7/2020 The animal origin of SARS-CoV-2 8/2021 The Strongest Evidence Yet That an Animal Started the Pandemic
A new analysis of genetic samples from China appears to link the pandemic’s origin to raccoon dogs. 3/2023 The Atlantic Two more coronaviruses can infect people, studies suggest 5/2021 U.N. Predicts Rise In Diseases That Jump From Animals To Humans Due To Habitat Loss 7/2020 Want to prevent pandemics? Stop spillovers. Decision-makers discussing landmark agreements on health and biodiversity must include four actions to reduce the risk of animals and people exchanging viruses. 5/2022 What are zoonotic diseases and what can we do about them? 5/2020 Why snakes probably aren't spreading the new China virus. One genetic analysis suggests reptilian reservoir — but researchers doubt that the coronavirus could have originated in animals other than birds or mammals. 1/2020 Why They're Called Wet Markets And What Health Risks They Might Pose 1/2020 WHO Points To Wildlife Farms In Southern China As Likely Source Of Pandemic 3/2021 Zoonotic origins of human coronaviruses 2020 Zoonotic spillover of SARS-CoV-2: mink-adapted virus in humans 3/2021
Back to Table of Contents
COVID-19 in Animals
Graphic source: https://www.pnas.org/content/119/6/e2121644119
Which SARS-CoV-2 variants have been identified in the different animal hosts?
Graphic source: https://www.nature.com/articles/s41597-022-01543-8
What is the case fatality rate of SARS-CoV-2 per animal host and country?
Graphic source: https://www.nature.com/articles/s41597-022-01543-8
Graphic source: https://www.who.int/docs/default-source/coronaviruse/who-convened-global-study-of-origins-of-sars-cov-2-china-part-annexes.pdf
Graphic source: https://www.who.int/docs/default-source/coronaviruse/who-convened-global-study-of-origins-of-sars-cov-2-china-part-annexes.pdf
Graphic source: https://www.who.int/docs/default-source/coronaviruse/who-convened-global-study-of-origins-of-sars-cov-2-china-part-annexes.pdf
Graphic source: https://www.ucdavis.edu/news/genomic-analysis-reveals-many-animal-species-may-be-vulnerable-sars-cov-2-infection
Graphic source: https://www.cdc.gov/mmwr/volumes/69/wr/mm6923e3.htm
SARS-ANI: a global open access dataset of reported SARS-CoV-2 events in animals 7/2022 Table 2 Number of globally reported SARS-CoV-2 cases (infections or exposures) per animal host (as of date of submission, 22 June 2022). 4 Michiganders with COVID-19 strain unique to mink were likely 1st U.S. spillover cases 4/2022 SARS-CoV-2 in Animals in the United States USDA.gov Animals and COVID-19 CDC.gov Captive deer in Texas show evidence of widespread COVID exposure 1/2025 Cases of SARS-CoV-2 in Animals in the United States USDA.gov Cases of SARS-CoV-2 in Animals in the United States PDF List Cats and dogs get COVID-19 from their owners at extremely high rates 7/2021 Confirmation of COVID-19 in Gorillas at a California Zoo 1/2021 Confirmed cases of SARS-CoV-2 in Animals in the United States USDA.gov Coronavirus: COVID detection like 'wine-tasting' for dogs who can sniff out the disease 6/2020 COVID-19 and Animals CDC.gov COVID Variants Detected in Animals, May Find Hosts in Mice 3/2021 Deer Populations Pose COVID Risk to Humans: Study 7/2023 Demand for cheetahs as pets is leading to their extinction. "When they hear the cheetah is expensive, they say, 'Wow, we must catch them and sell them,'" veterinarian Muse Saed . 8/2020 Denmark finds 214 people with mink-related coronavirus 11/2020 Denmark Will Kill All Farmed Mink, Citing Coronavirus Infections. Government officials said on Wednesday that a mutation in the virus could interfere with vaccine effectiveness in humans. 11/2020 Dogs exposed to COVID-positive people show increased risk of infection 9/2025 Evaluation for SARS-CoV-2 Testing in Animals 3/2021 Exclusive: Buddy, first dog to test positive for COVID-19 in the U.S., has died 7/2020 Experimental infection of domestic dogs and cats with SARS-CoV-2: Pathogenesis, transmission, and response to re-exposure in cats 9/2020 FAQ on Animal Coronavirus Testing First Reported Cases of SARS-CoV-2 Infection in Companion Animals - New York, March-April 2020 6/2020 Genomic Analysis Reveals Many Animal Species May Be Vulnerable to SARS-CoV-2 Infection 8/2020 Gorillas at San Diego Zoo Test Positive for COVID 1/2021 Helpful Questions and Answers about Coronavirus (COVID-19) and Your Pets FDA.gov Here's why Denmark culled 17 million minks and now plans to dig up their buried bodies. The Covid mink crisis, explained 12/2020 How Mink, Like Humans, Were Slammed by the Coronavirus. Rampaging infections at farms caused scandal, scientific head-scratching and a search for a vaccine — for mink. 12/2020 If You Have Pets CDC.gov Interim SARS-CoV-2 Guidance and Recommendations for Farmed Mink and Other Mustelids 8/2020 Multiple spillovers from humans and onward transmission of SARS-CoV-2 in white-tailed deer 2/2022 New unpublished studies show that dogs and cats with COVID-positive owners frequently have SARS-CoV-2 antibodies 7/2021 Pangolin coronavirus could jump to humans, research suggests 2/2021 Pets and Other Animals CDC.gov Preventing the next COVID-19 would be cheaper, safer than fighting a pandemic, study says 2/2022 Questions and Answers on the 2019 Coronavirus Disease (COVID-19) World Organization for Animal Health Reducing the Risk of SARS-CoV-2 Spreading between People and Wildlife CDC.gov Report Shows Arizona Man Infected His Dog, Cat With COVID-19 11/2021 Researcher finds 'stunning' rate of COVID among deer. Here's what it means for humans 3/2022 SARS-CoV-2 Exposure in Escaped Mink, Utah, USA 3/2021 NIH.gov SARS-CoV-2 infection in free-ranging white-tailed deer 12/2021 Nature.com SARS-CoV-2 Natural Transmission from Human to Cat, Belgium, March 2020 8/2020 SARS-CoV-2 variant detected in dogs and cats with suspected myocarditis 11/2021 SARS-CoV-2 variant detected in dogs and cats with suspected myocarditis 11/2021 San Diego Zoo Safari Park gorillas test positive for COVID-19 1/2021 SARS-CoV-2 Exposure in Norway Rats (Rattus norvegicus) from New York City 3/2023> Studies focus on SARS-CoV-2 transmission in domestic cats, pigs 11/2020 Study confirms cats can become infected with and may transmit COVID-19 to other cats 5/2020 The Coronavirus Kills Mink, So They Too May Get a Vaccine. The pandemic has been a powerful reminder that there is no clear barrier between viruses affecting animals and people 1/2021 There’s a Covid-19 epidemic in deer. It could come back to haunt us. Cats, dogs, and ferrets have been infected by the coronavirus. But outbreaks in deer are different. 2/2022 Transmission of SARS-CoV-2 in free-ranging white-tailed deer in the United States 7/2023 Transmission of SARS-CoV-2 on mink farms between humans and mink and back to humans 1/2021 Virus Variants Can Infect Mice, Scientists Report 3/2021 WHO looks at mink farm biosecurity globally after Danish coronavirus cases 11/2020 Widespread exposure to SARS-CoV-2 in wildlife communities 7/2024 Widespread SARS-CoV-2 Exposure Among Wildlife in the US 8/2024 JAMANetwork You dirty rats! Researchers find COVID-19 in NYC sewer rodents 11/2022 Your pets can catch Covid from you, and cats appear more susceptible than dogs. The more time a cat spent with its owner, the higher the risk of infection, new research finds. 6/2021
Back to Table of Contents
Genomic Sequencing Characteristics
The shades of blue are those vaccinated & never infected, which we saw in early 2021. But as #Delta surfaced & spread that year, it caused more severe illnesses, hospitalizations, & deaths. It wasn’t until late 2021 - early 2022 numbers began to change with #Omicron's appearance.
Graphic and Explanation source: https://twitter.com/IHME_UW/status/1633996138914144257
Graphic source: https://twitter.com/amorvincitomnia/status/1634026326855417862
"Experts' recommendations on how many cases should be sequenced vary, but many say sequencing around 5 percent of cases would begin to adequately show the spread of variants circulating at low levels."
(https://www.nytimes.com/interactive/2021/03/06/us/coronavirus-variant-sequencing.html)
Graphic source: https://www.nature.com/articles/d41586-021-03698-7
Graphic source: https://www.gao.gov/products/gao-21-426sp
Graphic source: https://www.cdc.gov/mmwr/volumes/69/wr/mm6928a5.htm
Graphic source: https://www.pnas.org/content/early/2020/06/09/2008176117
Graphic source: https://www.pnas.org/content/early/2020/06/09/2008176117
Graphic source: https://www.nytimes.com/interactive/2020/04/30/science/coronavirus-mutations.html
Graphic source: Nature Briefing
Graphic source; https://www.zmescience.com/science/cells-infected-coronavirus-95362/
Video source: https://www.nytimes.com/2020/04/22/us/coronavirus-sequencing.html
Back to Table of Contents
Genomics
Graphic source: https://twitter.com/EnemyInAState/status/1724226223541248433
Graphic source: Wang-Cell-PhylogeneticTree.jpg
SARS-CoV-2, the coronavirus that causes the disease COVID-19, is a big viral family with many variants. Just like with a human family tree, the distance between two variants shows roughly how related they are. This illustration is inspired by the SARS-CoV-2 phylogenetic tree generated by Emma Hodcroft of Nextstrain.org and the University of Bern. Kat Hubbs for NPR
Graphic source: https://www.npr.org/sections/goatsandsoda/2022/02/09/1047616658/take-a-look-at-sars-cov-2s-family-tree-its-full-of-surprises
A SARS-CoV-2 genetic family tree diagram, generated from data and diagrams created by Nextstrain.org and modified by epidemiologist Emma Hodcroft
But
Graphic source: https://www.npr.org/sections/goatsandsoda/2022/02/09/1047616658/take-a-look-at-sars-cov-2s-family-tree-its-full-of-surprises
Human leukocyte antigen (HLA) complex.
Interleukin-1 Receptor Antagonist Gene Varients
Vaccine-induced Mutations
Back to Table of Contents
Genetic Mutations; COVID-19 Variants
As of April 1, 2026
Graphic source: Force of Infection
As of May 1, 2024
Updated convergence map from Daniel Focosi showing the new variants, such as KP.2, KP.1.1, KS.1 variants) in the top right corner.
Graphic source: https://substack-post-media.s3.amazonaws.com/public/images/f837ed1f-7c7d-4184-848c-111ddf8db026_2048x1152.jpeg
Graphic source: https://twitter.com/HarrySpoelstra/status/1692901579517493724/photo/1
Graphic source: https://substack.com/redirect/558dc9ed-bd5e-4372-9ac0-1cab1335d132?j=eyJ1IjoiMWdtZDlpIn0.H-Wtg7K-Ao8Ujqb-A5XBDADPRFiGW837c9V5W-iH1lc
Antigenic Distance among COVID-19 Variants
Graphic source: https://twitter.com/EricTopol/status/1615138288129703937
As of November 4, 2022
Graphic source: https://publichealth.jhu.edu/2022/omicrons-many-subvariants Credit: Daniele Focosi, As of 11/4/2022
Graphic source: https://www.science.org/doi/10.1126/science.add8737
Graphic source:https://www.nature.com/articles/d41586-022-03445-6
Graphic source: https://www.methodsman.com/blog/omicron-specific-booster-what-to-do
Graphic source: https://twitter.com/DrWilliamKu/status/1547016992707723264
Graphic source: https://www.nibib.nih.gov/news-events/newsroom/nih-funded-project-offers-efficient-approach-when-tracking-sars-cov-2-variants
VIDEO
Graphic source: https://www.nytimes.com/interactive/2022/03/28/opinion/coronavirus-mutation-future.html
Virus Mutations Explained
Video Source: https://twitter.com/CDCgov/status/1484254407365738505
As of November 25, 2021
Graphic source: https://www.dailymail.co.uk/news/article-10242493/Is-Botswana-variant-sudden-Covid-surge-South-Africa.html
Graphic source: https://www.hindustantimes.com/india-news/sarscov2-variants-renamed-101622507347899.html
Graphic source: https://informationisbeautiful.net/visualizations/covid-19-coronavirus-infographic-datapack/
Graphic source: https://www.sciencemag.org/news/2021/08/new-sars-cov-2-variants-have-changed-pandemic-what-will-virus-do-next
Graphic source: NY Times, via F. Perry Wilson, Methods Man
VIDEO
Graphic source: Our World in Data
Graphic source: https://www.who.int/en/activities/tracking-SARS-CoV-2-variants/
Graphic source: https://www.who.int/en/activities/tracking-SARS-CoV-2-variants/
Graphic source: https://cosmosmagazine.com/health/medicine/new-variants-on-the-rise/#science
VIDEO
VIDEO
VIDEO
VIDEO
Graphic source: https://www.nytimes.com/interactive/2021/health/coronavirus-variant-tracker.html
Graphic source: https://www.webmd.com/lung/news/20210324/variants-of-variants-seen-in-covid-ravaged-brazil
Graphic source: https://usafacts.org/articles/1-in-6-americans-are-fully-vaccinated-and-4-more-new-things-about-covid-19/
Source: https://www.cdc.gov/mmwr/volumes/70/wr/mm7003e2.htm
Source: https://www.cdc.gov/mmwr/volumes/70/wr/mm7003e2.htm
Source: https://www.cdc.gov/mmwr/volumes/70/wr/mm7003e2.htm
Graphic source: https://www.nbcnews.com/health/health-news/map-track-spread-covid-19-variants-across-united-states-n1256131 March 9, 2021
Graphic source: https://www.cdc.gov/mmwr/volumes/70/wr/mm7008e1.htm
Graphic source: https://cosmosmagazine.com/health/medicine/mutations-variants-and-strains/
Graphic source: https://cov-lineages.org/global_report.html
Graphic source: https://www.cdc.gov/mmwr/volumes/70/wr/mm7003e2.htm
IMG SRC="BG2025/2021-CovidVariants.jpg" width=600 Alt="2021 variants">
Graphic source: https://www.voanews.com/a/covid-19-pandemic_infection-numbers-continue-decline-covid-19-response-team-warns-about-variants/6206785.html
COVID-19 Variant reported by Japan, January 11, 2021
Graphic source: https://www.niid.go.jp/niid/ja/diseases/ka/corona-virus/2019-ncov/10107-covid19-33.html
Graphic source: https://jamanetwork.com/journals/jama/fullarticle/2775006
Graphic source: https://www.nytimes.com/2020/12/21/health/new-covid-strain-uk.html
Graphic source:
https://time.com/5870481/coronavirus-origins/
Specific Variants
Graphic source: https://www.cnbc.com/2021/08/09/covid-epidemiologist-larry-brilliant-on-delta-variant-vaccinations.html
Graphic source: https://www.cdc.gov/mmwr/volumes/70/wr/mm7032e2.htm
Graphic source: https://twitter.com/CDCgov/status/1422286839457665031
Graphic source: https://www.youtube.com/watch?v=Ha6yUxze1vk&t=3s
The numerals in this illustration show the main mutation sites of the delta variant of the coronavirus, which is likely the most contagious version. Here, the virus's spike protein (red) binds to a receptor on a human cell (blue). [Juan Gaertner/Science Source]
Graphic source;https://www.npr.org/sections/goatsandsoda/2021/07/08/1013794996/why-the-delta-variant-is-so-contagious-a-new-study-sheds-light
VIDEO
BA.3.2 Variant AKA Cicada (November 2024, South Africa)
Graphic source: https://jamanetwork.com/journals/jama/fullarticle/2848071?guestAccessKey=67c073fd-6179-4694-bbe7-2d90fd33478c
SARS-CoV-2 BA.3.2 detections, by initial sample collection date - worldwide (A), Europe (B), and the United States (C),November 2024-February 2026
Early Detection and Surveillance of the SARS-CoV-2 Variant BA.3.2 - Worldwide, November 2024-February 2026 MMWR, 3/19/2026 What to Know About Cicada, or BA.3.2, the Latest SARS-CoV-2 Variant Under Monitoring JAMANetwork, 4/2026. CDC Report Calls BA.3.2 COVID-19 Variant Dubbed 'Cicada' A New Lineage Forbes, 3/28/2026. Early Detection and Surveillance of the SARS-CoV-2 Variant BA.3.2 - Worldwide, November 2024-February 2026 MMWR 3/19/2026 Map Shows New COVID Variant BA.3.2 Spread Across US Newsweek, 3/27/2026 New COVID variant with immune escape potential confirmed in US, 22 other countries CIDRAP, 3/23/2026 What To Know About BA.3.2, The Highly Mutated COVID Variant Spreading Through The World Right Now Huffpost, 3/26/2026 What to Know About Cicada, the New COVID Variant TIME, 3/31/2026
XFL Variant (April, 2025)
Graphic source: https://x.com/Mike_Honey_/status/1916885109950841038
Mike Honey @Mike_Honey_
NB.1.8.1 Variant AKA Nimbus (January 22, 2025)
Graphic source: https://jamanetwork.com/journals/jama/fullarticle/2837354
Graphic source: https://archive.md/KK2GC#selection-897.0-909.85
Graphic source: https://x.com/TRyanGregory/status/1927371947999957310/photo/1
NB.1.8.1 has a tangled family tree. It is a hybrid virus, built from a process called recombination, where several viruses – all versions of the Omicron COVID variant -infect the same cell and swap genetic material. It is descended from XDV -- a hybrid of JN.1 and XDE (a hybrid of GW.5.1 and FL.13.4).These events have equipped “Nimbus” with seven new mutations in its spike protein, which is the part of the virus that attaches to human cells, plus a further 20 changes elsewhere.
XFG Variant AKA Stratus (Southeast Asia, January, 2025)
Graphic source: https://x.com/TRyanGregory/status/1933177518888017973
XFG is a mix of two earlier variants: LF.7 and LP.8.1.2. It has four key mutations in its spike protein.
XEC Variant (June, 2024 Berlin, Germany; August 2, 2024)
FLiRT/KP.2 Variants (January 2, 2024)
Graphic source: https://www.bbc.com/future/article/20240111-covid-19-how-does-its-symptoms-differ-from-flu
BA.2.87.1 (Offspring of BA.2.86) (~September 2024, South Africa)
JN.1 (Offspring of BA.2.86) (~August 2024)
Graphic source: https://www.cdc.gov/respiratory-viruses/whats-new/JN.1-update-2024-01-05.html
Graphic source: https://jamanetwork.com/journals/jama/fullarticle/2814112
HV.1
Descendent of EG.5
JN.1 (Luxembourg, August 2023)
Video source: https://twitter.com/Mike_Honey_/status/1721112514325619001
BA.2.86 AKA Pirola (Israel, August 2023)
Graphic source: https://twitter.com/EricTopol/status/1716919400610381834
EU.1.1 (AKA XBB 1.15 descendent) (June 2023)
FL.1.5.1 (Fornax)
FU.1 (AKA XBB.1.16.1.1) and FU.2 (May 2023)
Graphic source: https://twitter.com/RajlabN/status/1649918584817086464
EG.5.1 AKA "ERIS" (mid-February 2023)
Video source: https://twitter.com/Mike_Honey_/status/1685950763837894656
XBB Cluster
XBB.1.9.1 (so-called Hyperion) (April 2023)
XBB.1.16 aka Arcturus (January 2023, Epicenter:Maharashtra, India)
September 26, 2023. The XBB.1.5 family tree
XBB and its sublineages (2023); XBB.1.5 (October 2022 US)
Graphic source: GISAID
BF.7 (November 2022)
XBB/Kraken variant (August 2022, India)
Graphic source: https://jamanetwork.com/journals/jama/fullarticle/2807145
Antigenic mapping of emerging SARS-CoV-2 omicron variants BM.1.1.1, BQ.1.1, and XBB.1 1/2023 Lancet.com
CDC now tracking subvariant XBB: 3 notes 11/2022 CDC reports a new strain of omicron taking over in the U.S.
About 40% of confirmed U.S. Covid cases are caused by the XBB.1.5 strain, up from 20% a week ago. 12/2022 COVID variant XBB.1.5 now accounts for 40 percent of cases in the US: CDC 12/2022 Doctors: New Omicron subvariant XBB.1.5 responsible for 75% of new COVID cases in Northeast 1/2023 Epidemiologic Characteristics of SARS-CoV-2 Recombinant Variant XBB.1.5 — New York City, November 1, 2022–January 4, 2023 MMWR 2/2023 Here's What to Know About XBB.1.5 — Its immune evasiveness didn't come at a cost in transmissibility, virologist says 1/2023 Highly immune evasive omicron XBB.1.5 variant is quickly becoming dominant in U.S. as it doubles weekly 12/2022 Kraken is the latest variant of COVID-19, but expect more mutations. The new subvariant of Omicron is close to taking over as the most-prevalent form of COVID in the U.S. 1/2023 New omicron subvariant on path to dominance, data suggests 12/2022 People who haven't had COVID will likely catch XBB.1.5 – and many will get reinfected, experts say 1/2023 The 'Kraken' COVID-19 subvariant is here in Canada. Here's what you need to know 1/2023 XBB now dominant Covid variant in U.S. 12/2022 XBB.1.5 FAQ: What you should know about the latest Omicron subvariant 1/2023
BQ.1.1; BA.2.75.2 (October 2022)
BF.7 (September 2022)
Winter 2022 Winter Surge (Immune Evasion)
B4.6 (August 2022 - )
B2.75 (Centaurus) (June 2022 - India)
BA.4; BA.5
COVID Hospitalizations Spiked in Youngest Infants During Omicron — However, indicators of severe disease "consistently lower" versus Delta period
Graphic source: https://www.nature.com/articles/d41586-022-01240-x
Omicron XE Variant (=BA.1 + BA.2)
BA2.12; BA2.12.1
B.1.640.2; BA.2, Stealth Variant
Delmicron; Deltacron
Omicron (AKA Botswana Variant; BA.1 ) (December 2021)
Graphic Source: https://www.thelancet.com/journals/lancet/article/PIIS0140-6736(21)02758-6/fulltext
https://www.economist.com/graphic-detail/2021/12/11/early-data-on-omicron-show-surging-cases-but-milder-symptoms
Graphic source: https://www.independent.co.uk/news/science/omicron-covid-variant-mutations-image-b1965780.html
Graphic source: https://www.standardmedia00 Alt=".co.ke/explainers/article/2001430674/how-south-african-scientists-spotted-the-omicron-covid-variant
Graphic source: https://www.cdc.gov/mmwr/volumes/70/wr/mm7050e1.htm
Graphic source: https://www.ft.com/content/42c5ff3d-e676-4076-9b9f-7243a00cba5e
Gradual emergence followed by exponential spread of the SARS-CoV-2 Omicron variant in Africa 12/2022 Awareness of SARS-CoV-2 Omicron Variant Infection Among Adults With Recent COVID-19 Seropositivity 8/2022 Omicron keeps finding new evolutionary tricks to outsmart our immunity 10/2022 What we know about omicron symptoms, recovery: A clinical timeline 1/2022 What we know about Omicron. The new coronavirus variant is spreading fast and raising concerns despite causing milder infections. 1/2022 Where has Omicron been Detected in the United States CDC.gov 12/2021
Update on Omicron 12/2021 Tracking omicron cases worldwide 12/2021 Covid-19: 'selfish mask' guest in quarantine hotel cross infection is Hong Kong's first case of new coronavirus variant 11/2021 Early data on Omicron show surging cases but milder symptoms
The variant's capacity for reinfection appears unprecedented 12/2021 Explainer: A new variant of COVID-19
How do we detect new variants, and should we be alarmed? 11/2021 Evidence for a mouse origin of the SARS-CoV-2 Omicron variant 12/2021
First Omicron Case Detected in the U.S. - But Fauci cautions this is an "n of 1" case 12/2021 Heavily mutated coronavirus variant puts scientists on alert. Researchers are racing to determine whether a fast-spreading variant in South Africa poses a threat to COVID vaccine's effectiveness. 11/2021 How Long Does Omicron Take to Make You Sick? The new variant seems to be our quickest one yet. That makes it harder to catch with the tests we have. 12/2021 B> How South African scientists spotted the Omicron Covid variant 12/2021
How variants like omicron develop and what makes them variants 'of concern'. The World Health Organization classified a new variant first identified in southern Africa as a "variant of concern" Friday. 11/2021 Investigation of a SARS-CoV-2 B.1.1.529 (Omicron) Variant Cluster - Nebraska, November-December 2021 12/2021 MMWR Multistate Outbreak of SARS-CoV-2 B.1.1.529 (Omicron) Variant Infections Among Persons in a Social Network Attending a Convention - New York City, November 18-December 20, 2021 2/2022 MMWR New Coronavirus Variant a "Serious Concern" in South Africa 11/2021 Omicron by the numbers: Where things stand now 12/2021 Omicron's Explosive Growth Is a Warning Sign. We don't know how severe Omicron is, but we do know it's spreading very fast. 12/2021 Omicron largely evades immunity from past infection or two vaccine doses 12/2021 Omicron SARS-CoV-2 variant: a new chapter in the COVID-19 pandemic 12/2021 Lancet Omicron: What We Know About the New Coronavirus Variant. In just a few weeks since its discovery, Omicron has turned out to be highly transmissible and less susceptible to vaccines than other variants. 1/2022 SARS-CoV-2 B.1.1.529 (Omicron) Variant - United States, December 1-8, 2021 12/2021 MMWR SARS-CoV-2 Viral Mutations: Impact on COVID-19 Tests 12/2021 Scientists find "stealth" version of Omicron that may be harder to track 12/2021 Scientists warn of new Botswana variant of Covid with "horrific" number of mutations 11/2021 Only 10 cases have been reported worldwide so far Scientists warn of new Covid variant with high number of mutations 11/2021 Super-mutant 'vaccine resistant' Botswana Covid variant is driving South African surge and is nearing dominance just WEEKS after first being detected - sparking calls for a new travel ban on region to prevent outbreak here 11/2021 The mystery of where omicron came from - and why it matters 12/2021 The Omicron variant: What we know so far 11/2021 Trends in Disease Severity and Health Care Utilization During the Early Omicron Variant Period Compared with Previous SARS-CoV-2 High Transmission Periods - United States, December 2020-January 2022 1/2022 MMWR What's known and unknown about Omicron, the coronavirus variant identified in South Africa 11/26/21 What you need to know about the omicron variant. Omicron is the newest Covid-19 "variant of concern," according to the World Health Organization. 11/2021 What we know about Omicron. The new coronavirus variant is spreading fast and raising concerns despite causing milder infections. 1/2022 What we know about Omicron variant that has sparked global alarm. Scientists fear emerging strain could be more transmissible and have higher resistance to vaccines 11/2021 What we know about the symptoms - and the severity - of the omicron variant 1/2022 WHO discusses new Covid variant possibly evolved in untreated AIDS patient. What we know so far 11/2021 Why This Covid-19 Surge Is 'Unprecedented in This Pandemic' 1/2022 'Worse than Delta': Alarm over Botswana Covid variant with multiple mutations 11/2021
Delta Variant
Graphic source: https://www.visualcapitalist.com/how-does-the-covid-delta-variant-compare/
Graphic source: mm7035e2_DeltaOutbreakCASchool.jpg
Clinical and genomic signatures of SARS-CoV-2 Delta breakthrough infections in New York 7/2022 Lancet Delta-like SARS-CoV-2 variants are most likely to increase pandemic severity 11/2021 Outbreak Associated with SARS-CoV-2 B.1.617.2 (Delta) Variant in an Elementary School - Marin County, California, May-June 2021 9/2021 MMWR What to Know About the New Delta Sublineage - CDC acknowledges AY.4.2 is stateside after quick spread in the U.K. 10/2021 Alpha variant of COVID-19 spread via 'super-seeding' event in UK, research finds 7/2021 A new coronavirus mutation is taking over the world. Here's what that means. 7/2020 A New Coronavirus Variant Is Spreading in New York, Researchers Report. The variant contains a mutation thought to help the virus dodge the immune system, scientists said. 2/2021 Another new coronavirus variant now detected in 13 countries. The variant, called B.1.525, contains a worrisome mutation. 2/2021 A Novel SARS-CoV-2 Variant of Concern, B.1.526, Identified in New York 2/2021 Pre-Print Can Vaccines Stop Variants? Here's What We Know So Far 4/2021 Changes in symptomatology, reinfection, and transmissibility associated with the SARS-CoV-2 variant B.1.1.7: an ecological study 4/2021 Lancet Common Coronavirus Mutation May Actually Make COVID-19 More Susceptible to a Vaccine 11/2020 Concerning new Lambda Covid variant found in Australia 7/2021 Coronavirus has mutated at least once into two strains, study finds 3/2020 Coronavirus variants are spreading in India — what scientists know so far. Variants including B.1.617 have been linked to India's surge in infections. Researchers are hurrying to determine how much of a threat they pose. 5/2021 Covid-19: Brazil virus already in UK 'not variant of concern', scientist says 1/2021 Covid-19: New coronavirus variant is identified in UK 12/2020 COVID-19 Outbreak Associated with a SARS-CoV-2 R.1 Lineage Variant in a Skilled Nursing Facility After Vaccination Program - Kentucky, March 2021 4/2021 MMWR COVID-19 Response Team Warns of Rise in Variants - But evidence that vaccines reduce transmissibility is pointing into a very favorable direction 2/2021 COVID-19 virus variants are evolving 'escape' mutations, and immune-compromised patients provide a breeding ground 2/2021 Covid variant in South Africa is 'more of a problem' than the one in UK, official says 1/2021 Delta Becomes Dominant Coronavirus Variant in U.S. 7/7/2021 Delta is the 'most serious' COVID-19 variant, scientists say. How will it affect the US? 6/2021 Delta Becomes Dominant Coronavirus Variant in U.S. 7/2021 Delta Plus Is in the News Again, Here's Why - The variant encompasses three sublineages, but experts are not worried yet 8/2021 Did a Mutation Help the Coronavirus Spread? More Evidence, but Lingering Questions 7/2020 Doctors Say These Are the 4 COVID Strains You Need to Know 1/2021 B> Doomsday scenario: Lagging vaccine rates stir fears of dangerous variants
Officials say the virus remains a persistent enough threat to potentially mutate into something that puts even vaccinated people at heightened risk. 5/2021
Double mutant coronavirus variant surfaces in Bay Area. Here's what we know 4/2021 Emergence of a Novel SARS-CoV-2 Variant in Southern California 2/2021
Emergence of SARS-CoV-2 B.1.1.7 Lineage - United States, December 29, 2020-January 12, 2021 1/2021 Emergency Committee on COVID-19 advises on variants, vaccines 1/2021 WHO.int Emerging Coronavirus Variants May Pose Challenges to Vaccines. Laboratory studies of mutations circulating in South Africa suggest they may dodge some of the body's immune responses. 1/2021 Evaluating the Effects of SARS-CoV-2 Spike Mutation D614G on Transmissibility and Pathogenicity 1/2021 Everything we know about the mu variant, the latest coronavirus mutation
The W.H.O. labeled mu as a "variant of interest" on Monday, noting it may be able to evade vaccines and antibodies 9/2021 Extraordinary Patient Offers Surprising Clues To Origins Of Coronavirus Variants 2/2021 FDA Issues Alert Regarding SARS-CoV-2 Viral Mutation to Health Care Providers and Clinical Laboratory Staff 1/2021 First confirmed case of Indian coronavirus variant in U.S. found in California. The strain was first detected last month by health officials in India. 4/2021 First Identified Cases of SARS-CoV-2 Variant B.1.1.7 in Minnesota - December 2020-January 2021 2/2021 MMWR First Vaccine Data Against Indian Variant - Researchers from England examined effectiveness of Pfizer, AstraZeneca vaccines 5/2021 Genetic Analysis Tracks SARS-CoV-2 Mutations in Human Hosts 6/2020 Genetic Variants of SARS-CoV-2 What Do They Mean? 1/2021 Genomic recombination events may reveal the evolution of coronavirus and the origin of SARS-CoV-2 12/2020 How Coronavirus Mutates and Spreads 4/2020 How Deadly Is the U.K. Variant? Updated analyses support worse clinical outcomes 2/2021 How Does the Coronavirus Variant Spread? Here's What Scientists Know. Contagiousness is the hallmark of the mutated virus surfacing in the U.S. and more than a dozen other countries. 12/2020 How SARS-CoV-2 mutates to escape antibody binding. A scientific detective story unearths how SARS-CoV-2 evolves new variants that evade antibodies 2/2021 How the Delta variant achieves its ultrafast spread. Viral load is roughly 1,000 times higher in people infected with the Delta variant than those infected with the original coronavirus strain, according to a study in China. 7/2021 Increased mortality in community-tested cases of SARS-CoV-2 lineage B.1.1.7 3/2021 India's New "Double Mutant" COVID Variant Emerges in U.S. - Stanford Identifies First Case 4/2021 How Worried Should You Be About COVID-19 Coronavirus Variants? 4/2021 Inside the B.1.1.7 Coronavirus Variant 1/2021 Japan has found a new Covid variant. Here's how it compares to virus strains in the UK, South Africa 1/2011 Know About Coronavirus Mutants and Variants that Could Have Contributed to India's Second Wave 4/2021 Lambda COVID Variant Discovered in UK 6/2021 Mutation in new coronavirus increases chance of infection: study 6/2020 Mutations in SARS-CoV-2 offer insights into virus evolution 5/2020 Neither Alternative Was Good News: An Immunologist Traces the Spread of P.1, the Brazilian COVID Variant 4/2021 New California Variant May Be Driving Virus Surge There, Study Suggests. Researchers found that the variant originated in California and showed up in more than half of samples tested last week by researchers in Los Angeles. 1/2021 New coronavirus variant identified in German hospital 1/2021 New coronavirus variants could cause more reinfections, require updated vaccines 1/2021 New coronavirus variant spotted in California raises alarm 2/2021 New COVID Strain Has Reached the U.S. 9/2021 R.1. strain New Covid variant detected at Texas A&M lab shows signs of antibody resistance and more severe illness in young people 4/2021 New COVID 'Super Strains' Could Disrupt Life Again 1/2021 New COVID-19 Variants CDC.gov New mutant strain of new coronavirus detected in returnees from Brazil (Japan) 1/2021 New SARS-CoV-2 Variant Discovered In Japan Nearly Identical To Dangerous Brazilian Variant 2/2021 New Study Sheds Light on Clinical Significance of "Mutant" SARS-CoV-2 From the United Kingdom 2/2021 New virus variant detected in India; experts urge caution 3/2021 Nigerian scientist studies country's coronavirus variant 1/2021 No evidence for increased transmissibility from recurrent mutations in SARS-CoV-2 11/2020 People Are Talking About A 'Double Mutant' Variant In India. What Does That Mean? 4/2021 Phylogenomic analysis of COVID-19 summer and winter outbreaks in Hong Kong: An observational study Lancet.com 3/2021 Rapid Emergence and Epidemiologic Characteristics of the SARS-CoV-2 B.1.526 Variant - New York City, New York, January 1-April 5, 2021 5/2021 MMWR Rapid Increase in Circulation of the SARS-CoV-2 B.1.617.2 (Delta) Variant - Mesa County, Colorado, April-June 2021 8/2021 MMWR SARS-CoV-2: British variant is 45 percent more contagious than the original virus, study finds 4/2021 SARS-CoV-2 lineage B.1.526 emerging in the New York region detected by software utility created to query the spike mutational landscape 2/2021 Pre-Print SARS-CoV-2 Vaccines and the Growing Threat of Viral Variants 1/2021 JAMA SARS-CoV-2 variant B.1.617 gives the immune system a hard time. Study with cell cultures shows that the mutant is less well inhibited by antibodies 7/2021 Sensitivity of infectious SARS-CoV-2 B.1.1.7 and B.1.351 variants to neutralizing antibodies 3/2021 Should We Be Concerned About the Lambda Variant? With its novel mutations, the variant first identified in Peru is being watched closely 7/2021 Southern California Is Origin of New COVID-19 Variant 2/2021 Spike Mutants from SARS-CoV-2 Variant B.1.1.7 The coronavirus has mutated and appears to be more contagious now, new study finds 5/2020 The Coronavirus Is Mutating. What Does That Mean for Us? Officials in Britain and South Africa claim new variants are more easily transmitted. There's a lot more to the story, scientists say. 12/2020 The COVID-19 Delta Variant: What to Know 6/2021 The Delta Variant Isn't Just Hyper-Contagious. It Also Grows More Rapidly Inside You 7/2021 The effects of virus variants on COVID-19 vaccines 3/2021 The Gamma Variant's Rise in Washington State - New data show COVID strain associated with the highest number of hospitalizations, deaths 7/2021 The Nature of the Virus to Mutate: Mapping the Spread of a Deadly Disease The new UK coronavirus mutations, explained 12/2020 Rise of Variants in Europe Shows How Dangerous the Virus Can Be 4/2021 SARS-CoV-2 variants from minks evade inhibition by antibodies 4/2021 The Delta Variant Will Drive A Steep Rise In U.S. COVID Deaths, A New Model Shows 7/2021 The U.K. Coronavirus Variant: What We Know 12/2020 The worst variant yet? Everything you need to know about Delta. Lots to learn about the dominant variant. 8/2021 There's a new coronavirus variant in the UK. Here's what we know. 12/2020 This Is How Bad Uncontrolled Delta Spread Could Get in the U.S.
"It is one of the most infectious respiratory viruses we know of, and that I have seen in my 20-year career." 7/2021 Tracking the Evolution of a "Variant of Concern" in Brazil 4/2021 Unraveling the Mysterious Mutations That Make Delta the Most Transmissible Covid Virus Yet 7/2021 U.S. Is Blind to Contagious New Virus Variant, Scientists Warn. It's not too late to curb the contagious variant's spread in the U.S., experts say — but only with a national program for genetic sequencing. 1/202<"> 1 Vaccine-induced antibodies may be less effective against several new SARS-CoV-2 variants 3/2021 Vaccines Are Effective Against the New York Variant, Studies Find 4/2021 Variant B.1.1.7 of COVID-19 associated with a significantly higher mortality rate, research shows 3/2021 Variants of Variants Seen In COVID-Ravaged Brazil 3/2021 Vietnam detects a suspected new coronavirus variant that's a hybrid of the UK and India strains 6/2021 Vietnam detects new UK-Indian variant, health officials say 5/2021 Virus that causes COVID-19 can find alternate route to infect cells. COVID-19 drugs, vaccines still effective against mutating virus 6/2021 Virus Variant First Found in Britain Now Spreading Rapidly in U.S. A new study bolsters the prediction by the Centers for Disease Control and Prevention that the so-called B.1.1.7 variant will dominate Covid-19 cases by March. 1/2021 Virus variant found in S. Africa may resist antibodies 1/2021 Virus Variant in Brazil Infected Many Who Had Already Recovered From Covid-19. The first detailed studies of the so-called P.1 variant show how it devastated a Brazilian city. Now scientists want to know what it will do elsewhere. 3/2021 Virus Variants Threaten to Draw Out the Pandemic, Scientists Say 4/2021 We may finally know why the delta variant of coronavirus is so infectious 7/2021 What Doctors Should Know About Delta - Here's the latest on transmissibility, virulence, vaccine efficacy, and more 6/2021 What's Going On With All These Coronavirus Variants? An Illustrated Guide 2/2021 What scientists know about new, fast-spreading coronavirus variants .Key questions remain about how quickly B.1.617 variants can spread, their potential to evade immunity and how they might affect the course of the pandemic. 5/2021 What the US knows about the three primary COVID-19 variants 2/2021 What's This About Delta Being 1,000 Times More Infectious? Here's where that frightening figure comes from 7/2021 What to Know About the Delta and Delta Plus Coronavirus Variants 7/8/2021 Why scientists are talking about viral load and the delta variant
What sets delta apart, experts say, is how much virus is produced by those who are infected — a measure known as viral load. 8/2021 Worried About Coronavirus Variants? Here's What You Need To Know 3/2021 Why Virus Variants Have Such Weird Names. B.1.351 may sound sweet to a molecular epidemiologist, but what's the alternative, other than stigmatizing geographical names? 3/2021 Why Scientists Are Very Worried About The Variant From Brazil 1/2021 Worrisome New Coronavirus Strains Are Emerging. Why Now? Across the globe, SARS-CoV-2 is evolving ways to evade the immune system and become more infectious. Blown pandemic response plans are to blame. 1/2021 Yale doctor weighs in on new report showing 2 COVID variants have merged into heavily-mutated hybrid virus 2/2021
Back to Table of Contents
Case Definition
VIDEO
Graphic source: https://www.ccjm.org/content/early/2020/12/01/ccjm.87a.ccc066
Graphic source: https://jamanetwork.com/journals/jama/fullarticle/2773338
Graphic source: https://www.medscape.org/viewarticle/927860
Graphic source: PriMed
Back to Table of Contents
Contact Tracing
Graphic source for 3: https://www.mckinsey.com/industries/public-sector/our-insights/contact-tracing-for-covid-19-new-considerations-for-its-practical-application
As the Virus Surged, Florida Partied. Tracking the Revelers Has Been Tough. 7/2020. With the coronavirus exploding, trying to trace the contacts of every positive case has become unrealistic in Florida, especially among elusive partygoers. Contact Tracing Apps GAO.gov Contact Tracing during Coronavirus Disease Outbreak, South Korea, 2020 11/2020 Contact Tracing Contact tracing is key to slowing the spread of COVID-19 and helps keep you, your family, and your community safe. Contact Tracing CDC.gov Contact Tracing Part of a Multipronged Approach to Fight the COVID-19 Pandemic Contact Tracing Is Failing in Many States. Here's Why. 7/2020 Contact Tracing: What We Can Learn From Outbreaks In Other Countries To Fight the Coronavirus | NPR via @YouTube Contact tracing, explained Contact tracing for COVID-19: New considerations for its practical application 5/2020 Escaping the coronavirus lockdown with test and trace. 4/2020 Epidemiologists believe that if it is properly employed, testing and tracing can allow the U.S. to open some businesses and relax social distancing requirements. Exposures Before Issuance of Stay-at-Home Orders Among Persons with Laboratory-Confirmed COVID-19 Colorado, March 2020 6/2020 MMWR Health Departments: Interim Guidance on Developing a COVID-19 Case Investigation & Contact Tracing Plan Identification and Monitoring of International Travelers During the Initial Phase of an Outbreak of COVID-19; California, February 3-March 17, 2020 MMWR 5/2020
Back to Table of Contents
Disease Distribution
SARS-CoV-2 introductions to U.S. and Europe. Credit: Modified from Worobey M, Science, 2020. (Source: 9/22/2020 NIH Director's Blog)
Percentage of people in communities across the United States infected by the novel coronavirus that causes COVID-19 as of December 2020. Credit: Pei S, Nature, 2021.
Graphic source: https://directorsblog.nih.gov/2021/09/07/covid-19-infected-many-more-americans-in-2020-than-official-tallies-show/
Graphic source: https://www.webmd.com/lung/news/20210824/covid-cases-in-children-soar
Graphic source: https://mma.prnewswire.com/media/1533546/A_Detailed_Study_of_Patients_with_Long_Haul_COVID__An_Analysis_of_Private_Health.pdf?p=pdf
Graphic source: https://mma.prnewswire.com/media/1533546/A_Detailed_Study_of_Patients_with_Long_Haul_COVID__An_Analysis_of_Private_Health.pdf?p=pdf
Graphic source: https://mma.prnewswire.com/media/1533546/A_Detailed_Study_of_Patients_with_Long_Haul_COVID__An_Analysis_of_Private_Health.pdf?p=pdf
Graphic source: https://mma.prnewswire.com/media/1533546/A_Detailed_Study_of_Patients_with_Long_Haul_COVID__An_Analysis_of_Private_Health.pdf?p=pdf
Graphic source: https://mma.prnewswire.com/media/1533546/A_Detailed_Study_of_Patients_with_Long_Haul_COVID__An_Analysis_of_Private_Health.pdf?p=pdf
Graphic source: https://www.economist.com/graphic-detail/2020/12/10/almost-one-in-five-americans-may-have-been-infected-with-covid-19
Graphic Source: https://www.cdc.gov/mmwr/volumes/69/wr/mm6939e4.htm
Graphic Source: https://www.cdc.gov/mmwr/volumes/69/wr/mm6939e4.htm
Graphic Source: https://www.cdc.gov/mmwr/volumes/69/wr/mm6939e4.htm
Graphic source: https://www.nytimes.com/interactive/2020/08/31/us/coronavirus-cases-children.html
COVID-19 incidence among school-aged children aged 5-11 years (N = 101,503) and 12-17 years (N = 175,782), by week - United States, March 1-September 19, 2020
Graphic source: https://www.cdc.gov/mmwr/volumes/69/wr/mm6939e2.htm
Percentage of SARS-CoV-2 reverse transcriptionpolymerase chain reaction (RT-PCR) tests with positive results and test volume, by week for school-aged children aged 5-11 years and 12-17 years - United States, May 3-September 19, 2020
Graphic source: https://www.cdc.gov/mmwr/volumes/69/wr/mm6939e2.htm
Graphic source: https://www.mercurynews.com/2020/06/16/age-of-covid-19-cases-dropping-in-california/
Graphic source; https://www.statista.com/chart/21173/hospitalization-icu-admission-and-fatality-rates-for-reported-coronavirus-cases/
Back to Table of Contents
Disease Process
Graphic source: https://www.sciencedirect.com/science/article/pii/S1319562X22000821
Graphic source: https://www.medscape.com/viewarticle/982538
Graphic source: https://www.medscape.com/viewarticle/982538
Graphic source: https://academic.oup.com/cid/article/72/8/1467/5896916
Graphic source: https://www.nih.gov/news-events/nih-research-matters/understanding-sars-cov-2-antibody-binding
The Process of How SARS-CoV-2 Infects the Host
Graphic source: https://www.acrobiosystems.com/A1213-The-Process-of-How-SARS-CoV-2-Infects-the-Host.html
Graphic source: https://media.primeinc.org/upload/programs/54BQ2021/Assessing%20COVID-19%20Disease%20Severity%20and%20Identifying%20Risk%20Factors%20for%20Disease%20Progression.pdf
Graphic source: https://earthsky.org/human-world/does-coronavirus-linger-in-body-immune-system-covid
Graphic source: https://pubs.rsna.org/doi/10.1148/radiol.2020201629
Graphic source; https://jamanetwork.com/journals/jama/fullarticle/2768391
ACE2 is the target for the novel coronavirus
Graphic source: https://content.iospress.com/articles/journal-of-alzheimers-disease/jad200581
Graphic source: https://hms.harvard.edu/news/how-covid-19-causes-loss-smell
NeuroCovid Stages
Graphic source: https://content.iospress.com/articles/journal-of-alzheimers-disease/jad200581
Scheme of the effects of severe acute respiratory syndrome coronavirus 2 (SARS-CoV-2) infection in obese individuals.
Graphic source: https://www.mayoclinicproceedings.org/article/S0025-6196(20)30477-8/fulltext
Graphic source: https://www.livescience.com/covid-19-superspreader-singing.html (Image credit: Nicholas Forder)
AGE WELL: On average, as this chart reveals, chronic diseases increase with aging, which makes the elderly more susceptible to COVID-19. This deadly combination is a stark reminder, again, of doing our best to stay healthy.
Graphic course: http://nautil.us/issue/84/outbreak/how-covid_19-picks-on-the-weakened. Aging and the Epidemiology of Multi-morbidity
Autopsies Show COVID-19 in the Brain — What this means for neurologic COVID symptoms remains elusive 12/2022 Biologist: Sharing Enclosed Space Leads To Massive Spread Of Coronavirus 5/2020 Core mitochondrial genes are down-regulated during SARS-CoV-2 infection of rodent and human hosts 8/2023 Coronavirus 101: What you need to know - Our understanding of COVID-19, the disease caused by the novel coronavirus, is evolving daily-but we do know some important basics. 3/2020 NATGEO Coronavirus Explained: What it does to your body that makes it so deadly 4/2020 Coronavirus: pathogen could have been spreading in humans for years, study says 3/2020 Covid-19:Viral Shedding From Virus Can Be Prolonged, But Infection Window is Not 11/2020 COVID Still Deadlier Than the Flu -- But the Gap Is Narrowing - VA study finds 35% higher mortality rate in hospitalized patients 5/2024 Does coronavirus linger in the body? 8/2020 Duration of Isolation and Precautions for Adults with COVID-19 8/2020 Duration of Severe Acute Respiratory Syndrome Coronavirus 2 (SARS-CoV-2) Infectivity: When Is It Safe to Discontinue Isolation? 4/2021 Estimated COVID-19 Burden CDC.gov Even 'mild' Covid-19 can be a lengthy, challenging illness 10/2020 Everest climbers could have spread 'potentially more infectious AND vaccine resistant' Nepal Covid variant across the world after it was first found in THIRTEEN travelers on flights from Himalaya to Japan 6/2021 First Molecular Profiles of Severe COVID-19 Infections 6/2020 NIH.gov Here's Exactly How the New Coronavirus Affects Your Body 1/2020 How a SARS-CoV-2 infection can become severe COVID-19 2/2022 How scientists know COVID-19 is way deadlier than the flu 7/2020 Natgeo How COVID-19 Picks on the Weakened: The wrath of the coronavirus. 3/2020 How The Coronavirus Attacks Your Lungs | Deep Look via @YouTube How the Coronavirus Could Take Over Your Body (Before You Ever Feel It) 3/2020 If You Squeeze the Coronavirus, Does It Shatter? Scientists are exploring the physics of viruses, to understand how these pathogens assemble themselves — and might be rent apart. 1/2021 Impact of non-pharmaceutical interventions (NPIs) to reduce COVID19 mortality and healthcare demand 3/2020 It's Not Whether You Were Exposed to the Virus. It's How Much. 5/2020 The pathogen is proving a familiar adage: The dose makes the poison. Mild Covid-19 Linked to Increased Inflammation in Cells Months Later, Study Finds 3/2022
Pathophysiology, Transmission, Diagnosis, and Treatment of Coronavirus Disease 2019 (COVID-19) A Review 7/2020 Portrait of a virus 8/2020 Preliminary Estimates of the Prevalence of Selected Underlying Health Conditions Among Patients with Coronavirus Disease 2019-United States, February 12-March 28, 2020 3/2020 Prevalence of Positive Rapid Antigen Tests After 7-Day Isolation Following SARS-CoV-2 Infection in College Athletes During Omicron Variant Predominance 10/2022 JAMANetwork SARS-CoV-2 can damage mitochondrion in heart, other organ 8/2023 SARS-CoV-2 infection and persistence in the human body and brain at autopsy 12/2022 SARS-CoV-2 infection drives an inflammatory response in human adipose tissue through infection of adipocytes and macrophages 9/2022 SARS-CoV-2 infection induces DNA damage, through CHK1 degradation and impaired
53BP1 recruitment, and cellular senescence 3/2023 Nature.com SARS-CoV-2 infects cells via specific viral entry factors, Viral entry factors are more abundant in elderly, men and smokers 3/2021 Scientists are trying to figure why Covid-19 hits some young, healthy people hard 4/2020 Solving a medical mystery and changing CDC screenings for COVID-19 What we learned from the first known community-acquired coronavirus case in the US 3/2020 The coronavirus at 1: A year into the pandemic, what scientists know about how it spreads, infects, and sickens 12/2020 Understanding SARS-CoV-2 antibody binding 10/2021 Why Covid-19 is worse than the flu, in one chart 3/2020 Why COVID-19 kills some people and spares others. Here's what scientists are finding. 6/2020 Why the 5-Day Isolation Period for COVID Makes No Sense 10/2022 Younger Adults Are Increasingly Testing Positive For The Coronavirus 6/2020
Co-morbidities
Co-infection
Reinfection
Graphic source: https://www.nature.com/articles/d41586-023-01371-9
Graphic source: https://www.longcovidkids.org/post/a-world-first-effect-of-covid-reinfection-on-people-living-with-long-covid
Graphic source: https://twitter.com/PeterJBeaver/status/1642077146414985217/photo/1
Risk and burden of sequelae in people with SARS-CoV-2 reinfection versus no reinfection.
Graphic source: https://www.nature.com/articles/s41591-022-02051-3/figures/1
Acute and postacute sequelae associated with SARS-CoV-2 reinfection 11/2022 Nature Medicine Are Repeat Coronavirus Infections Really More Dangerous Than the First?
— No, but a recent study has been misinterpreted by some as saying that 11/2022 Are repeat COVID infections dangerous? What the science says 4/2023 Nature.com A World First: Effect of Covid Reinfection on People Living With Long Covid 11/2022 COVID reinfections likely within one or two years, models propose. Estimates based on viral evolution forecast a 50% risk 17 months after a first infection without measures such as masking and vaccination. 10/2021 COVID reinfection may raise risk of persistent symptoms by 35% 8/18/2025 COVID-19 reinfection ups risk of long COVID, new data show 9/26/2024 Data suggest COVID-19 reinfections less likely to cause long COVID 5/2025 Does COVID Reinfection Increase Risk for Long COVID? 1/2023 Each COVID-19 Reinfection Increases Health Risks 7/2022 Here’s what might happen the second- or third- time you get Covid, experts say: 'There’s no guarantee' 10/2022 Infectiousness of SARS-CoV-2 breakthrough infections and reinfections during the Omicron wave 1/2023 Nature.com Investigative Criteria for Suspected Cases of SARS-CoV-2 Reinfection (ICR) 10/2020 CDC.gov Common Investigation Protocol for Investigating Suspected SARS-CoV-2 Reinfection 10/2020 CDC.gov Already had the coronavirus? You could get it again. Reinfection reports are still rare but steadily growing around the world, and they're likely underreported. 12/2020 Coronavirus Reinfections Are Real but Very, Very Rare 10/2020 Covid-19: First Case of Reinfection Reported In U.S. May Have Implications for Vax Dev 10/2020 COVID-19 Reinfection: More Common Than We Think? "Relatively alarming" study casts doubt on herd immunity developing from natural infection alone 3/2021 COVID-19 reinfection rate less than 1 percent for those with severe illness, study finds. Two deaths were associated with reinfection, but most cases were mild 6/2021 COVID-19 reinfection reported in Nevada patient, researchers say 8/2020 Dutch woman dies after catching Covid-19 twice, the first reported reinfection death 10/2020 First Case of COVID-19 Reinfection Confirmed; Viral sequence disparity indicates Hong Kong case not simply prolonged infection 8/2020
First Documented Coronavirus Reinfection Reported in Hong Kong 8/2020 Genomic evidence for reinfection with SARS-CoV-2: a case study 10/2020 Long COVID and associated outcomes following COVID-19 reinfections: Insights from an International Patient-Led Survey 9/2024 Preprint Long COVID Risk Makes It Worth Avoiding Second Infections 12/2022 Multiple COVID infections may raise your risk of long COVID 1/22/2025
NCI study finds that people with SARS-CoV-2 antibodies may have a low risk of future infection 2/2021 Reinfections More Likely With New Coronavirus Variants, Evidence Suggests 1/2021 SARS-CoV-2 Reinfection in a Liver Transplant Recipient 4/2021 AIM SARS-CoV-2 Reinfection Risk in Persons with HIV, Chicago, Illinois, USA, 2020–2022 11/2023 Risk of long COVID goes up with previous diagnoses 9/2023 Study finds 27% rate of long COVID in infected health workers 6/2023 Study shows past COVID-19 infection doesn't fully protect young people against reinfection 4/2021 Study suggests reinfections from the virus that causes COVID-19 likely have similar severity as original infection. NIH-funded analysis of health record data shows severe reinfections often follow severe first infections. 7/11/2024 NIH.gov The COVID-19 Reinfection Loop and What It Means for Americans’ Health. The continued emergence of new coronavirus variants means that protection from COVID-19 is fleeting and that herd immunity is likely unattainable. 7/2022 Trends in Laboratory-Confirmed SARS-CoV-2 Reinfections and Associated Hospitalizations and Deaths Among Adults Aged ≥18 Years — 18 U.S. Jurisdictions, September 2021–December 2022 6/2023 MMWR Two European patients re-infected with coronavirus 8/2020 What doctors wish patients knew about COVID-19 reinfection 1/2023 What we know about covid-19 reinfection so far 1/2021 BMJ.com You can get reinfected with Covid-19 but still have immunity. Let's explain. 8/2020
Back to Table of Contents
Disease Severity
Amy Proal, PhD @microbeminded2 findings like these are why @polybio has built a research program to delineate additional mechanisms of #SARS-CoV-2 & #spike persistence throughout the human body. This includes the impact of persistence on heart disease, #Alzheimer's, and mitochondrial dysfunction.
https://x.com/microbeminded2/status/1863322957004656735
VIDEO
Graphic source: https://media.primeinc.org/upload/programs/54BQ2021/Assessing%20COVID-19%20Disease%20Severity%20and%20Identifying%20Risk%20Factors%20for%20Disease%20Progression.pdf
Vulnerable Populations
Graphic source: https://www.webmd.com/lung/news/20200602/vulnerable-groups-weigh-risks-as-country-reopens
Graphic source: https://www.nejm.org/doi/full/10.1056/NEJMcp2009249
A blood atlas of COVID-19 defines hallmarks of disease severity and specificity 1/2022
Age-Related Differences in Nasopharyngeal Severe Acute Respiratory Syndrome Coronavirus 2 (SARS-CoV-2) Levels in Patients With Mild to Moderate Coronavirus Disease 2019 (COVID-19) 7/2020 Air pollution may affect severity and hospitalization in COVID-19 patients 4/2021 Among COVID-19 survivors, an increased risk of death, serious illness. Major study details numerous long-term effects of COVID-19, pointing to massive health burden 4/2021 Chest x-rays show more severe COVID-19 in non-white patients 7/2020 Half of Severe COVID Patients Developed New Medical Issues - Older adults more likely to develop complications, but young people not immune 7/2021 How comorbidities increase risks for COVID patients 3/2021 How the coronavirus can kill people. Most cases are mild, but the new virus is proving lethal to some Mild or Moderate Covid-19 NEJM.org 4/2020 More Exercise Lowers Risk of Severe COVID-19: Study 4/2021 Most Severe COVID Cases Tied to Four Conditions 2/2021 New cell atlas of COVID lungs reveals why SARS-CoV-2 is deadly and different 4/2021 New Studies Add to Evidence that Children May Transmit the Coronavirus 5/2020 New study identifies characteristics of patients with fatal COVID-19 4/2020 Physical inactivity linked to more severe COVID-19 infection and death. Surpassed only by advanced age and organ transplant as a risk factor, large study shows 4/2021 Prevalence of Long COVID Among Adults Who Have Ever Had COVID-19, by Selected Demographic and Socioeconomic Characteristics, U.S. Civilian Noninstitutionalized Population, Spring 2023 9/2024 AHRQ.gov Scientists Uncover Biological Signatures of the Worst Covid-19 Cases
Studies of patients with severe cases of Covid-19 show the immune system lacks its usual coordinated response. 8/2020 Severe Outcomes Among Patients with Coronavirus Disease 2019 (COVID-19); United States, February 12-March 16, 2020. MMWR Morb Mortal Wkly Rep. ePub: 18 March 2020.
Strong link found between abnormal liver tests and poor COVID-19 outcomes 8/2020 What triggers severe COVID? Infected immune cells hold clues. Studies have revealed that infected immune cells prompt a massive inflammatory response. 4/2022
Back to Table of Contents
Disease Statistics
Graphic source:
https://www.pewresearch.org/politics/2022/03/03/the-changing-political-geography-of-covid-19-over-the-last-two-years/
Graphic source:
https://www.pewresearch.org/politics/2022/03/03/the-changing-political-geography-of-covid-19-over-the-last-two-years/
Graphic source:
https://www.pewresearch.org/politics/2022/03/03/the-changing-political-geography-of-covid-19-over-the-last-two-years/
Graphic source:
https://www.pewresearch.org/politics/2022/03/03/the-changing-political-geography-of-covid-19-over-the-last-two-years/
Epidemic Curve of the Confirmed Cases of Coronavirus Disease 2019 (COVID-19)
Graphic source: https://jamanetwork.com/journals/jama/fullarticle/2762130
Graphic source: statista.com/chart/21547/cumulative-covid-19-cases-in-the-us/
Back to Table of Contents
Hospitalization Statistics
Graphic source: https://www.cdc.gov/mmwr/volumes/71/wr/mm7111e2.htm
Graphic source: https://www.cdc.gov/mmwr/volumes/71/wr/mm7106e2.htm
January 22, 2022
Map source: https://www.nbcnews.com/health/health-news/hospital-icu-stress-level-tracker-n1287375
Graphic source: https://cdn.mdedge.com/files/s3fs-public/JHM01607_Sabbatini15370721e.PDF
Map source: https://finance.yahoo.com/news/delta-variant-unvaccinated-and-vaccinated-people-are-not-in-the-same-ballpark-in-terms-of-risk-141843308.html
Graphic source: https://www.cdc.gov/mmwr/volumes/70/wr/mm7036e2.htm
Graphic source: https://www.cdc.gov/mmwr/volumes/70/wr/mm7036e1.htm
Graphic source: https://media.primeinc.org/upload/programs/54BQ2021/Assessing%20COVID-19%20Disease%20Severity%20and%20Identifying%20Risk%20Factors%20for%20Disease%20Progression.pdf
Graphic source: https://www.cdc.gov/mmwr/volumes/70/wr/mm7023e1.htm
Graphic source: https://www.gao.gov/reports/GAO-21-191/#Highlights
Graphic source: https://www.cdc.gov/mmwr/volumes/69/wr/mm6945e2.htm
Graphic source: https://www.cdc.gov/mmwr/volumes/69/wr/mm6924e2.htm
Graphic source: https://time.com/5867751/bars-covid/
Graphic source: https://www.kff.org/coronavirus-covid-19/slide/in-medicare-black-and-hispanic-individuals-account-for-disproportionate-share-of-covid-19-cases-and-hospitalizations/
Graphic source: https://www.medscape.org/viewarticle/931633
Graphic source: https://www.cdc.gov/coronavirus/2019-ncov/need-extra-precautions/older-adults.html
Graphic source: https://www.cdc.gov/mmwr/volumes/69/wr/mm6925e1.htm
Graphic source: https://www.statista.com/chart/22018/coronavirus-pre-existing-conditions/
COVID-NET Laboratory-confirmed COVID-19 hospitalizations CDC.gov Average charge for COVID-19 hospitalization, by state 10/2021 Characteristics Associated with Hospitalization Among Patients with COVID-19 - Metropolitan Atlanta, Georgia, March-April 2020 6/2020 Characteristics of Adult Outpatients and Inpatients with COVID-19 - 11 Academic Medical Centers, United States, March-May 2020 6/2020 Characteristics of Hospitalized COVID-19 Patients Discharged and Experiencing Same-Hospital Readmission - United States, March-August 2020. MMWR 11/2020 Clinical Characteristics and Outcomes Among Adults Hospitalized with Laboratory-Confirmed SARS-CoV-2 Infection During Periods of B.1.617.2 (Delta) and B.1.1.529 (Omicron) Variant Predominance - One Hospital, California, July 15-September 23, 2021, and December 21, 2021-January 27, 2022 2/2022 MMWR Clinical Outcomes in Young US Adults Hospitalized With COVID-19 9/2020
Coronavirus Disease 2019 Case Surveillance; United States, January 22-May 30, 2020 MMWR 6/2020 COVID-19 Claims Data Reveal Real-World Tx Costs; Median sticker prices in the low-middle five figures; "allowed amounts" around $20,000 7/2020 COVID-NET Laboratory-confirmed COVID-19 hospitalizations CDC.gov COVID-19: Healthcare Disparities 6/2020 COVID-19 hospitalizations analysis shows disparities across racial and ethnic groups 8/2020 COVID-19-Related Hospitalizations in Nine States, by Race/Ethnicity, 2020 3/2021 AHRQ.gov COVID Hospitalizations Soared With Delta - Delta variant twice as likely to land patients in hospital versus Alpha variant in U.K. study 8/2021 C.D.C. Releases Early Demographic Snapshot of Worst Coronavirus Cases 4/2020 Decreases in COVID-19 Cases, Emergency Department Visits, Hospital Admissions, and Deaths Among Older Adults Following the Introduction of COVID-19 Vaccine - United States, September 6, 2020-May 1, 2021 6/2021 MMWR Excess Mortality Among Patients Hospitalized During the COVID-19 Pandemic 7/2021 Hospitalizations Associated with COVID-19 Among Children and Adolescents - COVID-NET, 14 States, March 1, 2020-August 14, 2021 9/2021 MMWR Hospitalization of Adolescents Aged 12-17 Years with Laboratory-Confirmed COVID-19 - COVID-NET, 14 States, March 1, 2020-April 24, 2021 6/2021 Hospitalization of Infants and Children Aged 0–4 Years with Laboratory-Confirmed COVID-19 - COVID-NET, 14 States, March 2020-February 2022 3/2022 MMWR Hospitalization Rates and Characteristics of Patients Hospitalized with Laboratory-Confirmed Coronavirus Disease 2019 - COVID-NET, 14 States, March 1-30, 2020 4/2020 Hospitalizations of Children and Adolescents with Laboratory-Confirmed COVID-19 -COVID-NET, 14 States, July 2021-January 2022 2/2022 MMWR Key Characteristics of COVID-19 Patients 7/2020 Laboratory-Confirmed COVID-19–Associated Hospitalizations Among Adults During SARS-CoV-2 Omicron BA.2 Variant Predominance - COVID-19-Associated Hospitalization Surveillance Network, 14 States, June 20, 2021-May 31, 2022 8/2022 MMWR Medicare COVID-19 Hospitalization Trends Report 12/2022 Nearly All Patients Hospitalized With Covid-19 Had Chronic Health Issues, Study Finds Only 6 percent of patients at one New York area health system had no chronic conditions. Hypertension, obesity and diabetes were common. 4/2020 Pandemic predictions are tricky. Except this one: U.S. hospitals are not ready for the new normal 2/2022 Researchers reveal substantial disparities in COVID-19 hospitalization and death rates among New York City boroughs 4/2020 Severe Outcomes Among Patients with Coronavirus Disease 2019 (COVID-19) -United States, February 12-March 16, 2020 3/2020 Studies Point To Big Drop In COVID-19 Death Rates 10/2020 Trends in COVID-19 Cases, Emergency Department Visits, and Hospital Admissions Among Children and Adolescents Aged 0-17 Years - United States, August 2020-August 2021 9/2021 MMWR Trends in Racial and Ethnic Disparities in COVID-19 Hospitalizations, by Region - United States, March-December 2020 4/2021 MMWR Unvaccinated COVID-19 hospitalizations cost the U.S. health system billions of dollars 8/2021 U.S. COVID hospitalizations hit new record high, raising risks for patients 1/2022
Back to Table of Contents
Life Expectancy
IMG SRC="BG2021/NCHS-COVID-lifeexpectancy.jpg" width=800 Alt="COVID shortens life expectancy">
Graphic source: https://www.cdc.gov/nchs/data/vsrr/vsrr015-508.pdf
Back to Table of Contents
Potential Life Lost
Graphic source: https://www.healthsystemtracker.org/brief/covid-19-pandemic-related-excess-mortality-and-potential-years-of-life-lost-in-the-u-s-and-peer-countries/
Graphic source: https://www.healthsystemtracker.org/brief/covid-19-pandemic-related-excess-mortality-and-potential-years-of-life-lost-in-the-u-s-and-peer-countries/
Back to Table of Contents
Prevalence Statistics
Percentage of people in communities across the United States infected by the novel coronavirus that causes COVID-19 as of December 2020. Credit: Pei S, Nature, 2021.
Graphic source: https://directorsblog.nih.gov/2021/09/07/covid-19-infected-many-more-americans-in-2020-than-official-tallies-show/
Daily new confirmed COVID-19 cases per million people, Dec 9, 2020
The number of confirmed cases is lower than the number of actual cases; the main reason for that is limited
testing.
Graphic source: https://ourworldindata.org/coronavirus-data-explorer?tab=map&zoomToSelection=true&country=GBR~USA~ESP~ITA~BRA~IND~KOR®ion=World&casesMetric=true&interval=daily&hideControls=true&perCapita=true&smoothing=0&pickerMetric=location&pickerSort=asc
Model-based estimates of U.S. prevalence (A) and number (B) of adults aged ≥18 years with any selected underlying medical condition, by county United States, 2018
Graphic source: https://www.cdc.gov/mmwr/volumes/69/wr/mm6929a1.htm
Graphic source: https://www.cdc.gov/mmwr/volumes/69/wr/mm6929e1.htm
2022 Nationwide COVID-19 Infection- & Vaccination-Induced Antibody Seroprevalence (Blood donations) 6/28/2023 Antibody Seroprevalence Estimates of SARS-CoV-2 Seroprevalence and Incidence of Primary SARS-CoV-2 Infections Among Blood Donors, by COVID-19 Vaccination Status — United States, April 2021–September 2022 6/2023 MMWR Long COVID Prevalence Among Adults — United States, 2022 2/2024 Nationwide COVID-19 Infection-Induced Antibody Seroprevalence (Commercial laboratories) 2/2022 Commercial Laboratory Seroprevalence Survey Data 7/2020 Comparison of seroprevalence of SARS-CoV-2 infections with cumulative and imputed COVID-19 cases: Systematic review 4/2021 COVID-19 Infected Many More Americans in 2020 than Official Tallies Show 9/2021 NIH.gov COVID-19 Infections Underestimated From Sea to Shining Sea; Large serosurvey reinforces two ideas: most infections are asymptomatic, and herd immunity remains a distant goal 7/2020 Estimated County-Level Prevalence of Selected Underlying Medical Conditions Associated with Increased Risk for Severe COVID-19 Illness; United States, 2018 MMWR 7/2020 Mapping a Pandemic: SARS-CoV-2 Seropositivity in the United States 1/2021 Preprint Population Point Prevalence of SARS-CoV-2 Infection Based on a Statewide Random Sample Indiana, April 25-29, 2020 MMWR 7/2020 SARS-CoV-2 Serology and Self-Reported Infection Among Adults - National Health and Nutrition Examination Survey, United States, August 2021-May 2022 12/2022 MMWR
Seroprevalence Estimates of SARS-CoV-2 Infection in Convenience Sample Oregon, May 11-June 15, 2020 MMWR 8/2020 Seroprevalence of Antibodies to SARS-CoV-2 in 10 Sites in the United States, March 23-May 12, 2020 7/2020 Seroprevalence of Infection-Induced SARS-CoV-2 Antibodies — United States, September 2021–February 2022 4/2022 MMWR Seroprevalence of SARS-CoV-2 Among Frontline Health Care Personnel in a Multistate Hospital Network - 13 Academic Medical Centers, April-June 2020 MMWR 8/2020
Back to Table of Contents
Death Statistics
Graphic source: https://www.statista.com/chart/34077/deadliest-pandemics-epidemics/
Graphic source: https://x.com/OurWorldInData/status/1805239444036890784
This is a Timelapse map of every death from the coronavirus pandemic to June 30, 2020
Leading underlying causes of death — National Vital Statistics System, United States, 2022
Graphic source: https://www.cdc.gov/mmwr/volumes/72/wr/mm7218a3.htm
Graphic source: https://www.cdc.gov/mmwr/volumes/72/wr/mm7218a3.htm
Percentage* of COVID-19–associated deaths, by location of death — National Vital Statistics System, United States, January 2020–December 2022.
Provisional* number of COVID-19–associated deaths† and other deaths and percentage of COVID-19–associated deaths, by week of death — National Vital Statistics System, United States, 2022
Graphic source: https://www.cdc.gov/mmwr/volumes/72/wr/mm7218a3.htm
Graphic source: https://www.cdc.gov/mmwr/volumes/72/wr/mm7218a4.htm
Graphic source: https://www.cdc.gov/nchs/data/nvss/vsrg/vsrg03-508.pdf
Graphic source: https://www.cdc.gov/nchs/data/vsrr/vsrr025.pdf
Graphic source: https://www.cdc.gov/nchs/data/vsrr/vsrr025.pdf
Graphic source: https://www.cdc.gov/nchs/data/vsrr/vsrr025.pdf
Graphic source: https://www.cdc.gov/nchs/data/vsrr/vsrr025.pdf
Graphic source: https://www.healthsystemtracker.org/brief/the-state-of-the-u-s-health-system-in-2022-and-the-outlook-for-2023/
Graphic source: https://www.scientificamerican.com/article/who-is-dying-from-covid-now-and-why/
Graphic source:
https://jamanetwork.com/journals/jamainternalmedicine/fullarticle/2794043
Graphic source:
https://jamanetwork.com/journals/jamainternalmedicine/fullarticle/2794043
Graphic source: May 15, 2022 New York Times Cover
Graphic source: https://www.statnews.com/2022/05/10/the-five-pandemics-driving-1-million-u-s-covid-deaths/
Graphic source: https://www.statnews.com/2022/05/10/the-five-pandemics-driving-1-million-u-s-covid-deaths/
Graphic source: https://www.statnews.com/2022/05/10/the-five-pandemics-driving-1-million-u-s-covid-deaths/
Graphic source: https://www.statnews.com/2022/05/10/the-five-pandemics-driving-1-million-u-s-covid-deaths/
Graphic source: https://www.statnews.com/2022/05/10/the-five-pandemics-driving-1-million-u-s-covid-deaths/
Graphic source: https://www.statnews.com/2022/05/10/the-five-pandemics-driving-1-million-u-s-covid-deaths/
Graphic source: https://www.statnews.com/2022/05/10/the-five-pandemics-driving-1-million-u-s-covid-deaths/
Graphic source: https://www.statnews.com/2022/05/10/the-five-pandemics-driving-1-million-u-s-covid-deaths/
Graphic source: https://www.statnews.com/2022/05/10/the-five-pandemics-driving-1-million-u-s-covid-deaths/
Graphic source: https://www.healthsystemtracker.org/brief/covid-19-leading-cause-of-death-ranking/
Graphic source: https://www.healthsystemtracker.org/brief/covid-19-leading-cause-of-death-ranking/
Graphic source: https://www.healthsystemtracker.org/brief/covid-19-leading-cause-of-death-ranking/
Graphic source: https://www.healthsystemtracker.org/brief/covid-19-continues-to-be-a-leading-cause-of-death-in-the-u-s-in-august-2021/
Graphic source: https://www.healthsystemtracker.org/brief/covid-19-continues-to-be-a-leading-cause-of-death-in-the-u-s-in-august-2021/
Graphic source: https://www.cdc.gov/mmwr/volumes/70/wr/mm7014e1.htm
VIDEO
VIDEO
Graphic source: https://usafacts.org/articles/summer-covid-19-cases-and-deaths-in-five-charts/
Graphic source: https://usafacts.org/articles/summer-covid-19-cases-and-deaths-in-five-charts/
Graphic source: https://usafacts.org/articles/summer-covid-19-cases-and-deaths-in-five-charts/
Graphic source: https://www.pewresearch.org/fact-tank/2021/06/16/americans-lost-more-years-of-life-to-covid-19-in-2020-than-to-all-accidents-combined-in-a-typical-year/
Graphic source: https://www.pewresearch.org/fact-tank/2021/06/16/americans-lost-more-years-of-life-to-covid-19-in-2020-than-to-all-accidents-combined-in-a-typical-year/
Graphic source: https://www.nytimes.com/live/2021/06/16/world/covid-vaccine-coronavirus-mask
June 16, 2021 - US - 600,000 deaths from COVID-19
Graphic source: https://www.nytimes.com/live/2021/06/16/world/covid-vaccine-coronavirus-mask
Graphic source: https://jamanetwork.com/journals/jama/fullarticle/2778234
Graphic source: https://www.cdc.gov/mmwr/volumes/70/wr/mm7014e1.htm
Graphic source: https://www.mckinsey.com/featured-insights/coronavirus-leading-through-the-crisis/charting-the-path-to-the-next-normal/in-2020-covid-19-deaths-were-eight-times-greater-than-a-typical-flu-season
U.S. on Sunday, February 21, 2021, hit the half-a-million mark for the number of lives claimed by Covid-19.
Every dot on our 500,000 lives lost map represents a person who has died from the virus in the U.S., beginning with the first reported death on Feb. 29, 2020.
@NBCNews
Graphic source: Washington Post Coronavirus Update
Graphic source: https://www.gao.gov/reports/GAO-21-191/#Highlights
Graphic source: https://www.gao.gov/reports/GAO-21-191/#Highlights
Graphic source: https://jamanetwork.com/journals/jama/fullarticle/2771761
Graphic source: https://www.gao.gov/reports/GAO-20-708/
Graphic source: https://twitter.com/bettycjung/status/1286716769441320960
Graphic source: https://www.axios.com/axios-ipsos-coronavirus-week-8-5a1947d5-9850-4e58-9583-9b617e6fdc1b.html
Graphic source: https://www.theigc.org/blog/why-we-dont-know-the-real-number-of-covid-19-deaths-in-africa/
Estimated cumulative excess deaths during COVID-19, World August 20, 2025 The pandemic’s true death toll. Our daily estimate of excess deaths around the world 2025 Covid-19 Ranks Among Deadliest Disease Outbreaks in History 3/2025 Estimated cumulative excess deaths per 100,000 people during COVID-19, Jun 17,
2024 Provisional COVID-19 Mortality Surveillance CDC.gov Excess mortality across countries in the Western World since the COVID-19 pandemic: ‘Our World in Data’ estimates of January 2020 to December 2022 6/4/2024 BMJ.com Provisional COVID-19 Deaths, by Week, in The United States, Reported to CDC 1/2024 COVID-19 Mortality Update — United States, 2022 5/2023 MMWR Excess All-Cause Mortality in China After Ending the Zero COVID Policy 8/2023 JAMANetwork Provisional Mortality Data — United States, 2022 5/2023 MMWR Heart Transplants From Active COVID Donors Linked With Higher Mortality — Outcomes from donors with recently resolved COVID similar to those without SARS-CoV-2, however 5/2023 Identification of Deaths With Post-acute Sequelae of COVID-19 From Death Certificate Literal Text: United States, January 1, 2020–June 30, 2022 NVSS 12/2022 Expanded Guidance for Certifying Deaths Due to Post-Acute Sequelae of COVID-19 NVSS 2/2023 Guidance for Certifying Deaths Due to Coronavirus Disease 2019 (COVID-19) Expanded in February 2023 to Include Guidance for Certifying Deaths Due to Post-acute Sequelae of COVID-19 NVSS 2/2023 Higher Mortality Risk After COVID Lasts About 6 Months, VA Study Finds
— "We'll have to wait and see if that remains true for longer periods of time," researcher says 8/2023 Nearly 1.2 million excess deaths may have occurred in first 2 years of COVID pandemic 6/2023 Pandemic's Two-Year Global Death Toll May Be Close to 15 Million 12/2022 Study: China saw almost 2 million excess deaths just after zero-COVID policy ended 8/2023 The WHO estimates of excess mortality associated with the COVID-19 pandemic 12/2022 The 'five pandemics' driving 1 million U.S. Covid deaths 5/2022 Association Between Caseload Surge and COVID-19 Survival in 558 U.S. Hospitals, March to August 2020 ACP.org COVID-19 Death Rates in Urban and Rural Areas: United States, 2020 10/2022 COVID-19 Forecasts: Deaths CDC.gov Covid-19 is a leading cause of death for children in the US, despite relatively low mortality rate 1/2023 COVID-19 leading cause of death ranking KFF.org Covid death rates are higher among Republicans than Democrats, mounting evidence shows
Lower vaccination rates among Republicans could explain the partisan gap, but some researchers say mask use and social distancing were bigger factors. 10/2022 300,000 Deaths By December? 9 Takeaways From The Newest COVID-19 Projections 8/2020 Provisional Death Counts for Coronavirus Disease 2019 (COVID-19) Provisional Mortality Data - United States, 2020 4/2021 MMWR Assessment of Deaths From COVID-19 and From Seasonal Influenza 5/2020
Case-Fatality Rate and Characteristics of Patients Dying in Relation to COVID-19 in Italy 3/2020 Coronavirus Has Now Killed More Americans Than Vietnam War 4/2020 David Oliver: The medical examiner role could transform our approach to handling death 8/2020 Death Rates Have Dropped for Seriously Ill Covid Patients 10/2020 Explained: Why India's Covid-19 deaths are spiking even as cases go down 5/2021 Excess Deaths Associated with COVID-19 NVSS 4/2020
Excess Deaths From COVID-19 and Other Causes, March-July 2020 JAMA 10/2020 Excess Deaths From COVID-19 and Other Causes in the US, March 1, 2020, to January 2, 2021 JAMA 4/2021 How many Covid deaths are acceptable? Some Biden officials tried to guess. Conversations about what Americans would tolerate didn't go too far, underscoring the difficulty of explaining when the pandemic will end. 6/2022
Impact of SARS-CoV-2 Viral Load on Risk of Intubation and Mortality Among Hospitalized Patients with Coronavirus Disease 2019 7/2020 Just How Much Was 2020 an Outlier for Deaths? Setting cause aside, death numbers were "massive" compared with 2019 4/2021 Making up 1 million deaths: Where Covid killed 5/2022 Nearly all COVID deaths in US are now among unvaccinated 6/2021 One million Americans have died of COVID-19
Trace how demographics and locations of COVID-19 deaths shifted throughout the pandemic. 2/2023 One-Third of All U.S. Coronavirus Deaths Are Nursing Home Residents or Workers 5/2020
Provisional Death Counts for Coronavirus Disease (COVID-19) 4/2020 Provisional Mortality Data - United States, 2020 3/2021 MMWR Race, Ethnicity, and Age Trends in Persons Who Died from COVID-19 - United States, May-August 2020. MMWR 10/2020 The pandemic’s true death toll 12/2022 The Leading Causes of Death in the US for 2020 3/2021 JAMA Two Coasts. One Virus. How New York Suffered Nearly 10 Times the Number of Deaths as California. 5/2020 Vaccinations Against COVID-19 May Have Averted Up To 140,000 Deaths In The United States 8/2021 Who Is Dying from COVID Now, and Why
Nearly three years into the pandemic, COVID’s mortality burden is growing in certain groups of people 11/2022
Vaccination Efficacy
Graphic source: https://www.cdc.gov/mmwr/volumes/74/wr/mm7440a1.htm
Graphic source: https://ourworldindata.org/explorers/covid
Global impact of the first year of COVID-19 vaccination: a mathematical modelling study (9/2022)
Graphic source: https://www.thelancet.com/journals/laninf/article/PIIS1473-3099(22)00320-6/fulltext
Graphic source: https://jamanetwork.com/journals/jama/fullarticle/2813910?guestAccessKey=dd247aa1-70b6-4ab8-b69c-f9a681defb19
Graphic source: https://jamanetwork.com/journals/jama/fullarticle/2813910?guestAccessKey=54b24c64-2116-4698-8658-b7687f526b19
Graphic source: https://medicine.wustl.edu/news/risk-of-long-covid-declined-over-course-of-pandemic/
The risk of developing long COVID has decreased significantly over the course of the COVID-19 pandemic.
Researchers attributed about 70% of the risk reduction to vaccination against COVID-19 and 30% to changes over time, including the SARS-CoV-2 virus’s evolving characteristics and improved detection and management of COVID-19.
In more than 30 high-profile studies, Al-Aly has detailed the virus’s indiscriminate, long-term health impacts across nearly all organ systems affecting the heart, brain, kidneys and gastrointestinal (GI) tract.
“Long COVID is not over. We cannot let our guard down. This includes getting annual COVID vaccinations, because they are the key to suppressing long COVID risk. If we abandon vaccinations, the risk is likely to increase.”
Unsurprisingly, the rate of long COVID was the highest among those with the original strain, Al-Aly said, with 10.4% of those who had infections that developed into long COVID. That declined to 9.5% among those in the unvaccinated groups during the delta era and 7.7% during omicron.
Among the vaccinated, the rate of long COVID during delta was 5.3% and 3.5% during omicron. “You can see a clear and significant difference in risk during the delta and omicron eras between the vaccinated and unvaccinated,” said Al-Aly, “So, if people think COVID is no big deal and decide to forgo vaccinations, they’re essentially doubling their risk of developing long COVID.”
Graphic source: https://www.cdc.gov/mmwr/volumes/73/wr/mm7301a4.htm
Graphic source: https://jamanetwork.com/journals/jama/fullarticle/2813910
Graphic source:
https://www.cdc.gov/mmwr/volumes/71/wr/mm7112e1.htm
Graphic source: https://www.pewresearch.org/science/2022/07/07/americans-reflect-on-nations-covid-19-response/
Graphic source: https://www.scientificamerican.com/article/how-to-compare-covid-deaths-for-vaccinated-and-unvaccinated-people/
Graphic source: https://www.scientificamerican.com/article/how-to-compare-covid-deaths-for-vaccinated-and-unvaccinated-people/
Graphic source: https://www.scientificamerican.com/article/how-to-compare-covid-deaths-for-vaccinated-and-unvaccinated-people/
Graphic source: https://www.npr.org/sections/health-shots/2022/05/13/1098071284/this-is-how-many-lives-could-have-been-saved-with-covid-vaccinations-in-each-sta
Graphic source: https://www.npr.org/sections/health-shots/2022/05/13/1098071284/this-is-how-many-lives-could-have-been-saved-with-covid-vaccinations-in-each-sta
Graphic source: https://www.healthsystemtracker.org/brief/covid19-and-other-leading-causes-of-death-in-the-us/
Graphic source: https://www.healthsystemtracker.org/brief/covid19-and-other-leading-causes-of-death-in-the-us/
Graphic source: https://www.cdc.gov/mmwr/volumes/71/wr/mm7116e1.htm
Graphic source:
https://www.statnews.com/2022/04/06/tracking-fda-advisory-panel-meeting-covid-19-vaccines-boosters/
Graphic source:
https://www.statnews.com/2022/04/06/tracking-fda-advisory-panel-meeting-covid-19-vaccines-boosters/
Graphic source: https://www.cdc.gov/mmwr/volumes/71/wr/mm7112e2.htm
Graphic source: https://ourworldindata.org/covid-deaths-by-vaccination
Graphic source: https://ourworldindata.org/covid-deaths-by-vaccination
Age-adjusted rolling 14-day SARS-CoV-2 cumulative incidence (A) and hospitalization rates (B), by vaccination status - Los Angeles County, California, November 7, 2021-January 8, 2022
Graphic source: https://www.cdc.gov/mmwr/volumes/71/wr/mm7105e1.htm
Age-adjusted rolling 14-day SARS-CoV-2–associated incidence rate ratios* (A) and hospitalization rate ratios (B), by vaccination status - Los Angeles County, California, November 7, 2021-January 8, 2022
Graphic source: https://www.cdc.gov/mmwr/volumes/71/wr/mm7105e1.htm
Graphic source: January 31, 2022 NY TImes
Graphic source: January 31, 2022 NY TImes
Graphic source: https://www.vox.com/22894978/covid-19-vaccine-lives-saved-deaths-avoided-omicron-chart
Graphic source: https://www.nbcnews.com/health/health-news/booster-shots-effective-severe-illness-omicron-rcna13038
Graphic source: https://www.cdc.gov/mmwr/volumes/71/wr/mm7104e2.htm
Graphic source: https://www.cdc.gov/mmwr/volumes/71/wr/mm7104e2.htm
Graphic source: https://twitter.com/bettycjung/status/1482900702313820165
Graphic source: https://informationisbeautiful.net/visualizations/covid-19-coronavirus-infographic-datapack/
Graphic source: https://www.cdc.gov/mmwr/volumes/71/wr/mm7102e1.htm
Graphic source: https://www.healthsystemtracker.org/brief/characteristics-of-vaccinated-patients-hospitalized-with-covid-19-breakthrough-infections/
Graphic source: https://www.healthsystemtracker.org/brief/characteristics-of-vaccinated-patients-hospitalized-with-covid-19-breakthrough-infections/
Graphic source:
https://www.heraldextra.com/news/local/2021/dec/01/intermountain-official-warns-of-continued-protective-measures-vaccination-due-to-omicron/
Graphic source: https://www.statista.com/chart/26159/covid-cases-us-age-group-vaccination-status/
Graphic source: https://twitter.com/CDCgov/status/1464277862328979465
Graphic source: https://www.cdc.gov/
Graphic source: October 28, 2021 NY Times COVID Briefing
Graphic source: https://www.cdc.gov/mmwr/volumes/70/wr/mm7043e2.htm
Graphic source: https://www.medpagetoday.com/special-reports/exclusives/95119
Graphic source: https://ctnewsjunkie.com/2021/10/06/study-says-vaccinations-prevented-death-in-connecticut/
Graphic source: https://www.healthsystemtracker.org/brief/unvaccinated-covid-patients-cost-the-u-s-health-system-billions-of-dollars/
Graphic source: https://ctnewsjunkie.com/2021/09/03/a-high-price-hospital-association-assesses-cost-of-care-for-unvaccinated/
Graphic source: https://www.cdc.gov/mmwr/volumes/70/wr/mm7037e1.htm
Graphic source: https://usafacts.org/articles/summer-covid-19-cases-and-deaths-in-five-charts/
Graphic source: July 19, 2021 New York Times
Graphic source: https://www.cdc.gov/mmwr/volumes/70/wr/mm7023e2.htm
Graphic source: https://www.healthsystemtracker.org/brief/unvaccinated-covid-patients-cost-the-u-s-health-system-billions-of-dollars/
2024-2025 COVID-19 Vaccine and Major Adverse Cardiovascular Events Among US Veterans JAMANetwork, 6/2026 3 vaccine doses cut long-COVID risk by over 60%, analysis suggests 3/2025 Analysis of 25 studies shows reduced risk of long COVID after vaccination 11/2024 Association between long COVID and vaccination: A 12-month follow-up study in a low- to middle-income country 11/2023 Autoimmune Sequelae After Delta or Omicron Variant SARS-CoV-2 Infection in a Highly Vaccinated Cohort 8/2024 Comparison of Maternal–Fetal Outcomes among Unvaccinated and Vaccinated Pregnant Women with COVID-19 NIH.gov 12/2022 COVID-19 mRNA Vaccination and 4-Year All-Cause Mortality Among Adults Aged 18 to 59 Years in France JAMANetwork, 12/2025 COVID vaccines not linked to miscarriages CIDRAP, 10/2023 COVID vaccine protected kids from long COVID
Instead of special protection against long COVID, vaccines kept children and adolescents from developing the condition by blocking COVID-19 infections in the first place. 4/2025 COVID-19 Vaccines Reduce the Risk for Heart Attacks, Strokes 8/2024 Is Vaccination Approaching a Dangerous Tipping Point? 1/2024 Association Between Guillain-Barré Syndrome and COVID-19 Infection and Vaccination: A Population-Based Nested Case-Control Study 10/2023 COVID vaccine protects against symptoms 6 weeks after infection, study shows 9/2024 Data suggest hybrid immunity protects against long COVID 6/2024 Effectiveness of 2024-2025 COVID-19 Vaccines in Children in the United States - VISION, August 29, 2024-September 2, 2025 12/2025 MMWR Epidemiologic Features of Recovery From SARS-CoV-2 Infection 6/2024 Global impact of the first year of COVID-19 vaccination: a mathematical modelling study 9/2022 Incidence of heart attacks and strokes was lower after COVID-19 vaccination 8/2024 Interim Effectiveness of Updated 2023–2024 (Monovalent XBB.1.5) COVID-19 Vaccines Against COVID-19-Associated Emergency Department and Urgent Care Encounters and Hospitalization Among Immunocompetent Adults Aged ≥18 Years - VISION and IVY Networks, September 2023-January 2024 2/2024 MMWR Is Vaccination Approaching a Dangerous Tipping Point? 1/2024 Less than 5% of US preschool cohort hospitalized for COVID were fully vaccinated, study finds 12/2023 mRNA COVID vaccines tied to drop in death rate for 4 years 12/2025 New study confirms cardiovascular safety of COVID-19 vaccines 8/2025 Postacute Sequelae of SARS-CoV-2 Infection in the Pre-Delta, Delta, and Omicron Eras 7/2024 Recent COVID-19 vaccination tied to lower risk of long COVID 11/2024 Risk of long COVID declined over course of pandemic
Drop attributed mostly to vaccination but remaining risk still significant 7/2024 Study: 75% of infants hospitalized with COVID-19 born to unvaccinated women 9/2023 Study: Vaccinated patients have lower risk of long COVID 1/2024 Americans Reflect on Nation’s COVID-19 Response 7/2022 COVID-19 and Mental Illnesses in Vaccinated and Unvaccinated People 8/2024 JAMANetwork COVID-19-Associated Hospitalizations Among Vaccinated and Unvaccinated Adults 18 Years or Older in 13 US States, January 2021 to April 2022 9/2022 JAMA Association of COVID-19 Vaccination With Risk for Incident Diabetes After COVID-19 Infection 2/2023 JAMANetwork COVID deaths fell 84% in UK cancer patients after vaccine rollout 7/2023 Does COVID Vaccine Blunt Elevated Diabetes Risk After Infection? Unvaccinated had a 78% higher risk for new-onset diabetes; no link seen among the vaccinated 2/2023 Dynamics of inflammatory responses after SARS-CoV-2 infection by vaccination status in the USA: a prospective cohort study 8/2023 Early Estimates of Bivalent mRNA Vaccine Effectiveness in Preventing COVID-19–Associated Emergency Department or Urgent Care Encounters and Hospitalizations Among Immunocompetent Adults - VISION Network, Nine States, September-November 2022 12/2022 MMWR Early Estimates of Bivalent mRNA Vaccine Effectiveness in Preventing COVID-19–Associated Hospitalization Among Immunocompetent Adults Aged ≥65 Years - IVY Network, 18 States, September 8-November 30, 2022 12/2022 MMWR Effectiveness of mRNA Vaccination in Preventing COVID-19-Associated Invasive Mechanical Ventilation and Death - United States, March 2021-January 2022 3/2022 MMWR How to Compare COVID Deaths for Vaccinated and Unvaccinated People. The death rate among unvaccinated people is still far higher than that among the vaccinated even though vaccinated people now make up a significant proportion of deaths 6/2022 COVID-19 Vaccine Effectiveness Monthly Update 5/2022 This is how many lives could have been saved with COVID vaccinations in each state 5/2022 Costs of going unvaccinated in America are mounting for workers and companies 3/2022 COVID-19-Associated Hospitalizations Among Adults During SARS-CoV-2 Delta and Omicron Variant Predominance, by Race/Ethnicity and Vaccination Status - COVID-NET, 14 States, July 2021-January 2022 3/2022 MMWR Covid booster shots effective against severe illness from omicron, CDC studies say
Three studies released Friday by the CDC underscore the importance of a third dose to help keep Covid-19 patients out of the hospital. 1/2022 COVID-19 mortality preventable by vaccines 4/2022 COVID Vaccine Recipients Also Less Likely to Die of Other Causes - Study found downstream health effect for vaccination 10/2021 COVID-19 breakthrough hospitalizations 12/2021 COVID-19 Cases and Hospitalizations by COVID-19 Vaccination Status and Previous COVID-19 Diagnosis - California and New York, May-November 2021 1/2022 MMWR COVID-19 Incidence and Death Rates Among Unvaccinated and Fully Vaccinated Adults with and Without Booster Doses During Periods of Delta and Omicron Variant Emergence - 25 U.S. Jurisdictions, April 4-December 25, 2021 1/2022 MMWR Effectiveness of a Third Dose of Pfizer-BioNTech and Moderna Vaccines in Preventing COVID-19 Hospitalization Among Immunocompetent and Immunocompromised Adults - United States, August-December 2021 1/2022 Effectiveness of BNT162b2 (Pfizer-BioNTech) mRNA Vaccination Against Multisystem Inflammatory Syndrome in Children Among Persons Aged 12-18 Years - United States, July-December 2021 1/2022 MMWR Effectiveness of a Third Dose of mRNA Vaccines Against COVID-19-Associated Emergency Department and Urgent Care Encounters and Hospitalizations Among Adults During Periods of Delta and Omicron Variant Predominance - VISION Network, 10 States, August 2021–January 2022 1/2022 MMWR Estimated Number of COVID-19 Infections, Hospitalizations, and Deaths Prevented Among Vaccinated Persons in the US, December 2020 to September 2021 7/2022 JAMA Here's How Many U.S. Deaths COVID Vaccines Prevented CDC estimates 1.6 million hospitalizations and over 200,000 deaths averted through fall 2021 7/2022 How likely is COVID-19 hospitalization for vaccinated Americans?
Many vaccinated Americans have become infected with COVID-19, especially during the Omicron surge. But vaccination has made hospitalization much rarer. 2/2022 Omicron Hospitalizations Up to 23 Times Higher for the Unvaccinated - Boosters conferred the most protection, California data showed 2/2022 Post-COVID conditions following COVID-19 vaccination: a retrospective matched cohort study of patients with SARS-CoV-2 infection 5/2024 Nature.com Rates of COVID-19 Cases and Deaths by Vaccination Status CDC.gov Rates of laboratory-confirmed COVID-19 hospitalizations by vaccination status COVID.cdc.gov Recent COVID-19 Vaccination and Risk of SARS-CoV-2 Transmission JAMANetwork, 5/2026 Review estimates 69% 3-dose vaccine efficacy against long COVID 10/2023 Risk of type 2 diabetes may be higher up to 3 years after COVID infection in unvaccinated, severely ill 2/2026 A High Price: Hospital Association Assesses Cost of Care for Unvaccinated 9/2021 Before vaccines, 44% of COVID-19 patients in ICU died 5/2024 CDC Now Reports COVID Cases and Deaths by Vax Status - New tool also reveals numeric differences between vaccines 10/2021
Comparative Effectiveness of Moderna, Pfizer-BioNTech, and Janssen (Johnson & Johnson) Vaccines in Preventing COVID-19 Hospitalizations Among Adults Without Immunocompromising Conditions - United States, March-August 2021 9/2021 MMWR COVID-19 Vaccination and Non-COVID-19 Mortality Risk - Seven Integrated Health Care Organizations, United States, December 14, 2020-July 31, 2021 10/2021 MMWR Delta variant: Unvaccinated and vaccinated people 'are not in the same ballpark' of risk, doctor explains 9/2021 Effectiveness of 2, 3, and 4 COVID-19 mRNA Vaccine Doses Among Immunocompetent Adults During Periods when SARS-CoV-2 Omicron BA.1 and BA.2/BA.2.12.1 Sublineages Predominated - VISION Network, 10 States, December 2021–June 2022 7/2022 Impact of population mixing between vaccinated and unvaccinated subpopulations on infectious disease dynamics: implications for SARS-CoV-2 transmission 4/2022 Canadian Medical Association Journal Intermountain official warns of continued protective measures, vaccination due to omicron 12/2021 Laboratory-Confirmed COVID-19 Among Adults Hospitalized with COVID-19-Like Illness with Infection-Induced or mRNA Vaccine-Induced SARS-CoV-2 Immunity - Nine States, January-September 2021 10/2021 MMWR Monitoring Incidence of COVID-19 Cases, Hospitalizations, and Deaths, by Vaccination Status - 13 U.S. Jurisdictions, April 4-July 17, 2021 9/2021 MMWR Most COVID-19 Infections and Hospitalizations are in Unvaccinated 5/2021 Effectiveness of Maternal mRNA COVID-19 Vaccination During Pregnancy Against COVID-19–Associated Hospitalizations in Infants Aged <6 Months During SARS-CoV-2 Omicron Predominance — 20 States, March 9, 2022–May 31, 2023 9/2023 MMWR Maternal Covid-19 vaccination offers infants immunity for up to 6 months 10/2023 New COVID-19 Cases and Hospitalizations Among Adults, by Vaccination Status - New York, May 3-July 25, 2021 8/2021 New large study indicates vaccines protective against long COVID 2/2024
Rates of COVID-19 Cases and Deaths by Vaccination Status Rates of laboratory-confirmed COVID-19 hospitalizations by vaccination status CDC.gov Reduced risk of serious cardiovascular disease after COVID vaccination 9/2024 Risk of Death in Patients Hospitalized for COVID-19 vs Seasonal Influenza in Fall-Winter 2022-2023 (The risk of death decreased with the number of COVID-19 vaccinations) 4/2023 JAMAnetwork Risk of heart attack, stroke drops after COVID vaccination, data show 7/2024 SARS-CoV-2 Infection and Hospitalization Among Adults Aged ≥18 Years, by Vaccination Status, Before and During SARS-CoV-2 B.1.1.529 (Omicron) Variant Predominance — Los Angeles County, California, November 7, 2021–January 8, 2022 2/2022 MMWR Severe COVID Linked to Mental Illness in Weeks, Months After Infection - Risks for depression and serious mental illness highest among unvaccinated people 8/2024 States ranked by percentage of population fully vaccinated: Jan. 14 1/2022 Study Says Vaccinations Prevented Deaths In Connecticut 10/2021 Study shows 43% to 58% lower prevalence of long COVID among vaccinated people 2/2024 Studies suggest even one vaccine dose may cut risk of long COVID 11/2023 The effectiveness of vaccination against long COVID: A rapid evidence briefing 2/2022 The role of COVID-19 vaccines in preventing post-COVID-19 thromboembolic and cardiovascular complications 3/2024 BMJ.com The Unvaccinated Drive COVID-19 Infections in the U.S. 11/2021 Tracking an FDA advisory panel meeting on Covid-19 vaccines and boosters 4/2022 Unvaccinated COVID-19 hospitalizations cost billions of dollars 9/2021 Unvaccinated Over 10 Times More Likely to Be Hospitalized During Omicron - But hospitalizations among the vaccinated are on the rise 9/2022 Unvaccinated People Create Higher Risk for Vaccinated, Study Says 4/2022 University of Toronto Unvaccinated People Increase Risk Of Covid Infection Among Vaccinated, Study Finds 4/2022 Vaccinated Have Lower Heart, Stroke Risk From COVID - Korean nationwide data support yet another benefit of being fully vaccinated 7/2022 Vaccinations Cut U.S. COVID Deaths by 58%: Study 7/2022 Vaccination prevents short-term all-cause mortality in vulnerable patients with COVID-19 9/2023 Vaccination Tied to Shorter COVID Illness, Less Viral Shedding - Study in health workers also affirms milder infections with vaccination during Delta and Omicron 10/2022
Back to Table of Contents
Statistics Issues COVID-19 Test Reporting
COVID-19 Vaccination Reporting
Back to Table of Contents
Data Reporting
As COVID Data Collection Moves From CDC to HHS, Questions Mount - Administration says new process will be more efficient; but public health community fears disruption, manipulation 7/2020 As Schools Weigh Reopening, Dearth of Data on COVID in Kids; Age groupings vary by state, children under-tested: "It's a mess" 7/2020 Assessment of the CDC's New COVID-19 Data Reporting Version 1.0, May 18, 2020 Claiming confusion, Texas Medical Center changes how it reports ICU capacity amid COVID-19 6/2020 Covid data disappearing in some states even as delta surges. As Covid case numbers rise nationwide, Georgia and some other states have restricted the case count data they share publicly. 8/2021 Covid-19 in the US: We're not getting full value from our data 7/2020 BMJ opinion Does Green on COVID-19 Maps Mean What You Think? COVID-19 “heat maps” are intended to help the public evaluate health risks during the pandemic. But the guidelines the CDC and other institutions use to create these maps can lead to confusion. Two linguistic anthropologists help make sense of what these maps really mean.
3/2022 Florida scientist says she was fired for refusing to change Covid-19 data to support reopen plan. 5/2020. Dr Rebekah Jones says she was fired from Department of Health by the governor after protesting order to censor information I'm looking for the truth: States face criticism for COVID-19 data cover-ups 5/2020 Johns Hopkins's coronavirus tracker has become a gold standard, but its creators say many miss the real story 6/2020 Many States Are Not Reporting The Latest COVID-19 Numbers 9/2021 Nation's latest COVID-19 wave largely hidden from view, health experts say. 'There's a lot of COVID out there,' one expert acknowledged. 5/2022 Nursing Homes Shocked at 'Insanely Wrong' CMS Data on COVID-19 6/2020 One facility supposedly had eight coronavirus deaths for each bed Omicron wave prompts media to rethink which data to report 1/2022 States Pull Back on Covid Data Even Amid Delta Surge 8/2021 KHN.org Woman who designed Florida's COVID-19 dashboard has been removed from her position 5/2020
Back to Table of Contents
Death Statistics Issues
Graphic source: https://www.nature.com/articles/d41586-022-01245-6
Graphic source: https://www.nature.com/articles/d41586-022-00104-8
Graphic source: https://www.nature.com/articles/d41586-022-00104-8
Graphic source: https://twitter.com/WHO/status/1522195970825535488/photo/1
Graphic source: https://twitter.com/WHO/status/1522210454113714176/photo/1
Graphic source: https://www.bbc.com/news/health-61327778
Graphic source: https://www.bbc.com/news/health-61327778
Graphic source: https://www.bbc.com/news/health-61327778
Figure 2Global distribution of estimated excess mortality rate due to the COVID-19 pandemic, for the cumulative period 2020–21
Map source: https://www.thelancet.com/journals/lancet/article/PIIS0140-6736(21)02796-3/fulltext
Figure 4Global distribution of the ratio between estimated excess mortality rate due to the COVID-19 pandemic and reported COVID-19 mortality rate, for the cumulative period 2020–21
Map source: https://www.thelancet.com/journals/lancet/article/PIIS0140-6736(21)02796-3/fulltext
Graphic source: https://twitter.com/MaxCRoser/status/1434228604666368007/photo/1
The Economist journalists updated their a model of the true death toll of the pandemic, corrected for underreporting. They come to the conclusion that 15.2 million have died, more than 3-times the official toll of 4.6m. This map shows the distribution of the death rate.
14.9 million excess deaths associated with the COVID-19 pandemic in 2020 and 2021 WHO.int 5/2022 15 million people have died in the pandemic, WHO says
The World Health Organization’s long-awaited estimate of excess COVID deaths is in line with other studies. 5/2022 A Coronavirus Mystery Explained: Moscow Has 1,700 Extra Deaths. Russia's government has boasted of a low coronavirus mortality rate, but figures from an obscure city agency cast doubt on those claims. 5/2020
Assessing the Impact of the Covid-19 Pandemic on US Mortality: A County-Level Analysis 1/2021 Autopsies and covid-19. America’s elected coroners are too often a public-health liability
The politics of death 1/2022 Challenges Estimating Total Lives Lost in COVID-19 Decisions 7/2020. Consideration of Mortality Related to Unemployment, Social Isolation, and Depression COVID death tolls: scientists acknowledge errors in WHO estimates. Researchers with the World Health Organization explain mistakes in high-profile mortality estimates for Germany and Sweden. 5/2022 COVID's Global Death Toll May Be 3 Times Official Numbers 3/2022 COVID mortality in India: National survey data and health facility deaths 1/2022 COVID’s true death toll: much higher than official records. Modelling suggests that by the end of 2021, some 18 million people had died because of the pandemic. 3/2022 Covid: World’s true pandemic death toll nearly 15 million, says WHO 5/2022 Death Certificate-Based ICD-10 Diagnosis Codes for COVID-19 Mortality Surveillance - United States, January-December 2020 MMWR 3/2021 Deaths in New York City Are More Than Double the Usual Total 4/2020 Early official COVID death tolls may have undercounted by 19% CIDRAP, 3/2026 Estimating excess mortality due to the COVID-19 pandemic: a systematic analysis of COVID-19-related mortality, 2020–21 3/2022 Hospitalizations of Children Aged 5–11 Years with Laboratory-Confirmed COVID-19 - COVID-NET, 14 States, March 2020-February 2022 4/2022 How Many Covid Deaths? Don't Ask President Trump. The president has expressed skepticism about the fatality figures reported to him by his own experts. 5/2020 How many died? Different ways of counting make the COVID-19 tally elusive "It becomes fairly random, and we're basically at that point," N.Y. Gov. Andrew Cuomo said. 6/2020 India Is Counting Thousands Of Daily COVID Deaths. How Many Is It Missing? 4/2021 India Is Stalling the W.H.O.’s Efforts to Make Global Covid Death Toll Public. The agency has calculated that 15 million people have died as a result of the pandemic, far more than earlier estimates, but has yet to release those numbers. 4/2022 In one Missouri county, coroner excludes COVID from death certificates if family asks 8/2021 More than 150,000 uncounted Covid-19 deaths occurred early in the pandemic, a study finds. That translates to about 16% of Covid-19 deaths that went uncounted in those years Associated Press/Statnews, March 18, 2026. NIH study associates COVID-19 surges with mortality increases for patients 7/2021 Nobody Accurately Tracks Health Care Workers Lost to COVID-19. So She Stays Up At Night Cataloging the Dead. 8/2020 Op-Ed: Death Counts and Despair - Are we growing numb to the COVID carnage? 8/2020 Peru says its true Covid death toll is almost triple its official count. 5/2021 Russian statistics soar for virus-linked deaths in 2020 2/2021 Study: 35 percent of excess deaths in pandemic's early months tied to causes other than COVID-19 7/2020 Surprisingly low Shanghai COVID death count spurs questions 4/2022 The Difficulty Of Counting the COVID-19 Pandemic's Full Death Toll 6/2020 The lag between daily reported Covid-19 cases and deaths and its relationship to age 3/2021 The pandemic’s true death toll: millions more than official counts
Countries have reported some five million COVID-19 deaths in two years, but global excess deaths are estimated at double or even quadruple that figure. 1/2022 Total Deaths Due to COVID-19 Underestimated by 20% in US Counties. Deaths caused by indirect effects of the pandemic emphasize the need for policy changes that address widening health and racial inequities. 5/2021 BU.edu Uncounted: Inaccurate death certificates across the country hide the true toll of COVID-19 Some counties, like Cape Girardeau, have seen a spike in deaths that aren’t attributed to COVID-19. Many of them, blamed on natural causes, are likely from the coronavirus 1/2022 Undercounting of Covid-19 deaths is greatest in pro-Trump areas, analysis shows 1/2021 US COVID-19 Deaths May Have Been Underreported, Study Finds JAMANetwork, 4/3/2026 U.S. deaths soared in early weeks of pandemic, far exceeding number attributed to covid-19 4/2020 Virus deaths are probably two to three times more than official records, the W.H.O. says. 5/2021 What to Say if Someone Wrongly Claims 99% of People Survive COVID Why Do Countries' COVID-19 Death Rates Vary So Much? Multiple factors at play: testing capacity, case definitions, age distribution, preparedness 5/2020 Why Do Vaccinated People Represent Most COVID-19 Deaths Right Now? 11/2022 Why we still don't know how deadly this new coronavirus is 2/2020. Without the mortality rate, it's hard to decide how to respond and prepare for a worsening outbreak. Why We Don't Know the True Death Rate for Covid-19 4/2020 Determining what percentage of those infected by the coronavirus will die is a key question for epidemiologists, but an elusive one during the pandemic. Worst-Case Estimates for U.S. Coronavirus Deaths 3/2020
Hospitalization Data Issues
Incomplete/Missing Demographics and Variables, Reporting
Graphic source: https://www.covkidproject.org/state-report-card
Manipulation of Data Reporting
Graphic source: https://www.miamiherald.com/news/coronavirus/article253796898.html
Graphic source: https://www.miamiherald.com/news/coronavirus/article253796898.html
Back to Table of Contents
Prevalence Data
Probable Cases/Excess Deaths
Graphic source: https://jamanetwork.com/journals/jama-health-forum/fullarticle/2834281
Graphic source: https://www.nature.com/articles/d41586-022-00104-8
Graphic source: https://www.vox.com/future-perfect/21539483/covid-19-black-death-plagues-in-history
Visual Abstract. Impact of Population Growth and Aging on Excess U.S. Deaths During COVID-19
Graphic source: https://www.acpjournals.org/doi/10.7326/M20-7385
Graphic source: https://www.kff.org/coronavirus-covid-19/slide/during-pandemic-higher-premature-excess-deaths-in-u-s-compared-to-peer-countries-partly-driven-by-racial-disparities/
Graphic source: https://www.healthsystemtracker.org/brief/covid-19-pandemic-related-excess-mortality-and-potential-years-of-life-lost-in-the-u-s-and-peer-countries/
Graphic source: https://www.healthsystemtracker.org/brief/covid-19-pandemic-related-excess-mortality-and-potential-years-of-life-lost-in-the-u-s-and-peer-countries/
Graphic source: https://www.healthsystemtracker.org/brief/covid-19-pandemic-related-excess-mortality-and-potential-years-of-life-lost-in-the-u-s-and-peer-countries/
Graphic source: https://jamanetwork.com/journals/jama/fullarticle/2778361
Graphic source: https://www.economist.com/graphic-detail/2020/07/15/tracking-covid-19-excess-deaths-across-countries
Excess US Deaths Before, During, and After the COVID-19 Pandemic 5/2025 COVID's Death Toll 3 Times Worse Than Official Counts - In U.S. alone, excess deaths were 300,000 higher than those attributed to virus 3/2022 Covid-19 deaths in Africa: prospective systematic postmortem surveillance study 2/2021 BMJ Covid-19: Excess deaths point to hidden toll in South Africa as cases surge 7/2020 BMJ COVID-19 Pandemic-Related Excess Mortality and Potential Years of Life Lost in the U.S. and Peer Countries 4/2021 During Pandemic, Higher Premature Excess Deaths in U.S. Compared to Peer Countries Partly Driven by Racial Disparities 4/2021 Estimating the early death toll of COVID-19 in the United States Estimation of Excess Deaths Associated With the COVID-19 Pandemic in the United States, March to May 2020 7/2020 JAMA Excess Deaths Associated with COVID-19.
Provisional Death Counts for Coronavirus Disease (COVID-19) 8/24/2022 CDC Excess deaths associated with covid-19 pandemic in 2020: age and sex disaggregated time series analysis in 29 high income countries 5/2021 BMJ.com Excess Deaths From COVID-19 and Other Causes in the US, March 1, 2020, to January 2, 2021 4/2021 JAMA Getting to Accuracy: Measuring COVID-19 by Mortality Rates and Percentage Changes 4/2020 How COVID-19 Deaths Are Counted. 5/2020. Assigning a cause of death is never straightforward, but data on excess deaths suggest coronavirus death tolls are likely an underestimate How coronavirus charts can mislead us How does the government count COVID-19 deaths? Medical conditions or injuries at an individual's time of death are not automatically official causes of death for the purpose of government statistics. That includes COVID-19. 10/2021 How Many People Have Actually Died From Coronavirus in New York? 4/2020 The official statistics paint a partial picture and may understate the death toll. Here's why. Impact of Population Growth and Aging on Estimates of Excess U.S. Deaths During the COVID-19 Pandemic, March to August 2020 4/2020 AIM Just How Much Was 2020 an Outlier for Deaths? Setting cause aside, death numbers were "massive" compared with 2019 4/2021 N.Y.C. Death Toll Soars Past 10,000 in Revised Virus Count 4/2020. The city has added more than 3,700 additional people who were presumed to have died of the coronavirus but had never tested positive. Pandemic death toll is far higher than 200,000 in the US 10/2020 'Probable' COVID-19 Death Reporting Varies by State 4/2020. Authorities wrestle with fatal cases that look like COVID but lack test confirmation
Provisional COVID-19 Deaths by Week, Sex, and Age CDC/NCHS Racial and Ethnic Disparities in Excess Deaths During the COVID-19 Pandemic, March to December 2020 10/2021. ACPjournals.org The Pandemic's Real Toll? 300,000 Deaths, and It's Not Just From the Coronavirus 10/2020 Tracking covid-19 excess deaths across countries 7/2020
Two Years of Excess Deaths: What Can We Learn? - First, let's look at the data 8/2022 Medpagetoday.com Update on Excess Deaths Associated with the COVID-19 Pandemic - United States, January 26, 2020-February 27, 2021
4/2021 MMWR
Undercounting
Graphic source: https://www.bmj.com/content/372/bmj.n334
Graphic source: https://www.npr.org/sections/health-shots/2021/02/06/964527835/why-the-pandemic-is-10-times-worse-than-you-think
Graphic source: https://www.npr.org/sections/health-shots/2021/02/06/964527835/why-the-pandemic-is-10-times-worse-than-you-think
< P>
China Covid: Five deaths under country's new counting method 12/2022 Health Equity Tracker Investigating rates of COVID-19 A Coronavirus Death in Early February Was Probably the Tip of an Iceberg 4/2020 After Deaths At Home Spike In NYC, Officials Plan To Count Many As COVID-19 3/2020 Africa COVID cases could be seven times higher than reported - WHO 2/2022 As Covid sweeps India, experts say cases and deaths are going unreported 4/2021 CDC Hasn't Updated COVID Vax Breakthrough Data - Agency doesn't report real-time breakthrough data, but states provide some answers 11/2021 Coronavirus Death in California Came Weeks Before First Known U.S. Death 4/22/2020 Covid: Does Tanzania have a hidden epidemic? 3/2021 BBC.com England and Wales coronavirus death toll 41% higher than UK government's daily figures 4/2020 Impact of COVID-19 in Africa 'vastly underestimated', warn researchers. Study from Zambia shows many more deaths than official reports suggest 2/2021 Impact of covid-19 in Africa "vastly underestimated" warn researchers 2/2021 BMJ India Is Counting Thousands Of Daily COVID Deaths. How Many Is It Missing? . 4/2021 India's pandemic death toll could be in the millions 7/2021 Millions Of People Are Missing From CDC COVID Data As States Fail To Report Cases 10/2021 NIH study suggests COVID-19 prevalence far exceeded early pandemic cases. Researchers estimate nearly 17 million undiagnosed cases in the U.S. by mid-July 2020. 6/2021 Non-stop cremations cast doubt on India's counting of COVID dead 4/2021 Official coronavirus death tolls are only an estimate, and that is a problem 4/2020 NBC News takes a look at how some of the world's health authorities have tried, and often failed, to keep track of those who have died in the pandemic. Official U.S. coronavirus death toll may be missing many thousands. 5/2020 A confluence of testing shortages, inconsistent death reporting practices and a high concentration of nursing home deaths means the overall fatality number is likely higher. Russia adds record 10,000 coronavirus cases in dramatic turnaround as Putin's problems stack up 5/2020 There's Been a Spike in People Dying at Home in Several Cities. That Suggests Coronavirus Deaths Are Higher Than Reported. 4/2020 Trump's plan to limit the pandemic's death toll: Undercount the numbers. Experts say the official numbers are too low. The White House wants to make them lower. 5/2020 U.S. Coronavirus Death Toll Is Far Higher Than Reported, C.D.C. Data Suggests 4/2020
Why we don't know the real number of COVID-19 deaths in Africa 10/2020 Why the coronavirus may be killing more Americans than the government data says 4/2020 Why The Pandemic Is 10 Times Worse Than You Think NPR.org 2/2021
Vaccination Reporting
Back to Table of Contents
COVID-19 Protective Factors
Graphic source: https://diabetesjournals.org/care/article-abstract/doi/10.2337/DCa24-0032/157171/Prevalent-Metformin-Use-in-Adults-With-Diabetes
Back to Table of Contents
COVID-19 Protective Factors Get Vaccinatated!
COVID-19 Risk Factors
August 18, 2025
Graphic source: https://www.nejm.org/doi/full/10.1056/NEJMsb2506929
Graphic source: https://www.nejm.org/doi/full/10.1056/NEJMsb2506929
Graphic source: https://www.acpjournals.org/doi/10.7326/AITC202310170
Graphic source:
https://emergency.cdc.gov/coca/ppt/2023/012423_slides.pdf
Risk factors for severe COVID-19 among persons who completed a primary COVID-19 vaccination series - 465 health care facilities, United States, December 2020-October 2021 (MMWR)
Graphic source: https://www.cdc.gov/mmwr/volumes/71/wr/mm7101a4.htm
Risk Factors (Enlarged)
Graphic source: https://www.cdc.gov/coronavirus/2019-ncov/hcp/clinical-care/underlyingconditions.html
Graphic source: https://informationisbeautiful.net/visualizations/covid-19-coronavirus-infographic-datapack/
Graphic source: https://www.mckinsey.com/featured-insights/2020-year-in-review/a-tale-of-2020-in-20-mckinsey-charts
Graphic source: https://www.medscape.org/viewarticle/941521
Graphic source: https://www.statista.com/chart/22365/prevalence-of-underlying-conditions-in-us-adults/
Graphic source: Texas Medical Association
Graphic source: https://www.cdc.gov/coronavirus/2019-ncov/need-extra-precautions/older-adults.html
Graphic source: https://www.cdc.gov/coronavirus/2019-ncov/need-extra-precautions/people-with-medical-conditions.html
Graphic source: https://www.cdc.gov/coronavirus/2019-ncov/need-extra-precautions/people-with-medical-conditions.html
Graphic source: https://www.cdc.gov/coronavirus/2019-ncov/downloads/COVID19-What-You-Can-Do-High-Risk.pdf
Graphic source: https://www.nejm.org/doi/full/10.1056/NEJMcp2009249
Blood Type
Graphic source: https://www.medscape.org/viewarticle/935827
Cardiovascular
Alcohol
Cancer
Graphic source: https://www.sciencedirect.com/science/article/pii/S092544392400557X
Demographics
Graphic source: https://www.cnn.com/2020/08/20/us/systemic-racism-coronavirus-pandemic-trnd/index.html"
Graphic source: https://www.apmresearchlab.org/covid/deaths-by-race
Graphic source: https://www.apmresearchlab.org/covid/deaths-by-race
Risk Factors for Severe COVID-19 Outcomes Among Persons Aged ≥18 Years Who Completed a Primary COVID-19 Vaccination Series - 465 Health Care Facilities, United States, December 2020-October 2021 1/2022 MMWR No Data Behind CDC's Testing Guideline Change; Absent any evidence, experts speculate that supply shortages, politics influenced agency's decision Black individuals at higher risk for contracting COVID-19, according to new research 7/2020 Coronavirus targets homeless shelters in the US 4/2020
COVID-19 Among American Indian and Alaska Native Persons -23 States, January 31-July 3, 2020 MMWR 8/2020 COVID-19 Killing African Americans at Shocking Rates 5/2020. Wildly disproportionate mortality highlights need to address longstanding inequities COVID-19 crisis: Millions of US workers at risk of infections on the job 4/2020 Crowded homes, poor neighborhoods linked to COVID-19 6/2020 Male Sex Is Risk Factor for Increased Mortality in COVID-19 12/2020 Study of 17 Million Identifies Crucial Risk Factors for Coronavirus Deaths 7/2020. The largest study yet confirms that race, ethnicity, age and sex can raise a person's chances of dying from Covid-19. COVID-19 deaths analyzed by race and ethnicity — APM Research Lab Factors Influencing Risk for COVID-19 Exposure Among Young Adults Aged 18-23 Years - Winnebago County, Wisconsin, March-July 2020. MMWR October 2020. Regardless of Age, Obesity and Hypertension Increase Risks With COVID-19 9/2020 These variables affect whether you live, die or get help during the pandemic 8/2020 Why Is COVID-19 Striking Men Harder Than Women? 5/2020 Why Women Experience COVID and the Vaccines Differently Than Men - It's chromosomal and hormonal, and maybe sociocultural too 3/2021
Diabetes
Graphic source: https://link.springer.com/article/10.1007/s00125-021-05458-8
Graphic source: https://abcnews.go.com/Health/covid-19-virus-diabetes-studies-find/story
Graphic source: https://link.springer.com/article/10.1007/s00125-021-05458-8
Drugs
Environmental Factors
Gender
Genetic Mutations
Health Behaviors
HIV
Hypertension
Immune System
Liver Disease
Lung (Pulmonary) Disease
Maternal/Child Health Issues
Mental Illness
Metabolic Syndrome
Nutrition
Obesity
Graphic source: https://jamanetwork.com/journals/jamainternalmedicine/fullarticle/2770542
Graphic source: https://www.mayoclinicproceedings.org/article/S0025-6196(20)30477-8/fulltext
Clinical manifestations and mechanisms for COVID-19 risk in individuals with obesity
Graphic source: https://onlinelibrary.wiley.com/doi/10.1111/obr.13128
Associations between body-mass index and COVID-19 severity in 6·9 million people in England: a prospective, community-based, cohort study 4/2021 < /B> Body Mass Index and Risk for COVID-19-Related Hospitalization, Intensive Care Unit Admission, Invasive Mechanical Ventilation, and Death - United States, March-December 2020 3/2021 MMWR Clinical Outcomes in Young US Adults Hospitalized With COVID-19 9/2020 COVID-19 reveals how obesity harms the body in real time 11/2020 Even With Mild COVID, Obesity May Mean Worse Symptoms 10/2021 Individuals with obesity and COVID-19: A global perspective on the epidemiology and biological relationships 8/2020 Long COVID: Could mono virus or fat cells be playing roles? 12/2022 NYU scientists: Largest US study of COVID-19 finds obesity the single biggest 'chronic' factor in New York City's hospitalizations 4/2020 ZDNET.com Obese COVID Patients More Likely to Have Pulmonary Embolism, Even Outside the ICU 6/2020 Obesity and Outcomes in COVID-19: When an Epidemic and Pandemic Collide 7/2020 Obesity Linked to Severe Coronavirus Disease, Especially for Younger Patients 4/2020 Obesity May Raise Risk of Long COVID in Youth. Researchers observed dose-response relationship for increasing BMI and long COVID risk 10/2024 Obesity one of the biggest risk factors in COVID-19 hospitalizations, study suggests 4/2020 Obesity raises risk of COVID infection by 34%, study estimates 8/2024 Sex-specific impact of severe obesity in the outcomes of hospitalized patients with COVID-19: a large retrospective study from the Bronx, New York 5/2021 Why Obesity May Stack the Deck for COVID-19 Risk 7/2020
Phenotypes
Stroke
Tobacco/Vaping
Graphic source: https://www.who.int/news-room/spotlight/more-than-100-reasons-to-quit-tobacco
"Experts have warned that the coronavirus — a respiratory pathogen — most likely capitalizes on the scarred lungs of smokers and vapers. Doctors and researchers are now starting to pinpoint the ways in which smoking and vaping seem to enhance the virus's ability to spread from person to person, infiltrate the lungs and spark some of Covid-19's worst symptoms." https://www.nytimes.com/2020/09/04/health/covid-vaping-smoking.html
Vaping Links to Covid Risk Are Becoming Clear 9/2020 Other Factors
10 Things That Increase Your Risk of Coronavirus Complications Alzheimer's Gene Linked to Severe COVID-19 Risk 5/2020 Canadian study finds temperature, latitude not associated with COVID-19 spread 5/2020 Can I Catch It Through My Eyes? Will Goggles Help? 5/2020 CDC: Age Nothing But a Number for COVID-19 Risks; Underlying conditions for people at any age more important, agency says 6/2020 Contracting COVID-19: lifestyle and social connections may play a role 7/2020 Coronavirus and Pneumonia 4/2020 COVID-19: High-Risk Groups and Special Populations 4/2020 COVID-19 Risk 10-Fold Higher for Opioid Abusers 9/2020. Substance use disorders in general tied to higher coronavirus hospitalization rates COVID Risks Raised in Rheumatoid Arthritis - Patients had higher rates of infection and hospitalization/death, study showed 5/2021 FAQs About COVID-19 4/2020 Groups at Higher Risk for Severe Illness 4/2020 Heartburn medication tied to higher COVID-19 risk — but don't panic 7/2020 HIV and The New Coronavirus Insomnia, disrupted sleep, and burnout linked to higher odds of severe COVID-19. Each 1-hour increase in sleep associated with 12% lower odds of infection among clinicians 3/2021 Is Taking Aspirin Good for Your Heart? Large Vessel Strokes in Younger Patients Tied to COVID-19, 4/2020. Presenting symptom of coronavirus infection for some Miscarriage and Maternal Mortality in Pregnant COVID-19 Patients; Risk is unknown but nonzero 5/2020 New Research Shows Disproportionate Rate of Coronavirus Deaths in Polluted Areas 12/2020 Older Adults CDC.gov People With O Blood Type Appear to Have a Lower Risk of Catching Coronavirus, Preliminary Study Says 6/2020 People of Any Age with Underlying Medical Conditions 6/2020 Poor Sleep, Burnout Tied to Higher COVID-19 Risk 3/2021 Preliminary Estimates of the Prevalence of Selected Underlying Health Conditions Among Patients with Coronavirus Disease 2019-United States, February 12-March 28, 2020 3/2020 MMWR Substance use disorders linked to COVID-19 susceptibility 9/2020 The Catastrophic Cost of Uninsurance: COVID-19 Cases and Deaths
Closely Tied to America's Health Coverage Gaps 3/2021 The Covid-19 Riddle: Why Does the Virus Wallop Some Places and Spare Others? 5/2020 This One Thing Could Make You More Likely to Die From Coronavirus 6/2020 What Is Phantosmia? 3/2021 What Is the Real Coronavirus Toll in Each State? 5/2020
Back to Table of Contents
COVID-19 Incubation Period Nature: Estimated that the incubation period for COVID-19 before the onset of symptoms was 5.2 days. Viral loads for COVID-19 were highest shortly after the onset of symptoms and then gradually decreased toward the detection limit by day 21. Sex, age, and disease severity did not substantially affect these findings.
The authors estimated that infectiousness of COVID-19 began 2.3 days before the onset of symptoms and peaked at 0.7 days after symptom onset. They further estimated that up to 44% of cases of COVID-19 could be a result of viral transmission before the onset of symptoms.
Graphic source: https://www.nejm.org/doi/full/10.1056/NEJMcp2009575
Back to Table of Contents
COVID-19 Symptoms
Symptom prevalence, duration, and risk of hospital admission in individuals infected with SARS-CoV-2 during periods of omicron and delta variant dominance: a prospective observational study from the ZOE COVID Study
Graphic source: https://www.thelancet.com/journals/lancet/article/PIIS0140-6736(22)00327-0/fulltext
Graphic source: https://www.reuters.com/article/us-health-coronavirus-types/symptom-tracker-app-reveals-six-distinct-types-of-covid-19-infection-idUSKCN24I1YI
Graphic source; https://salud-america.org/coronavirus-case-rates-and-death-rates-for-latinos-in-the-united-states/
Odds ratios and 95% confidence intervals of previous or current SARS-CoV-2 infection, by individual symptoms among service members reporting at least one symptom (n = 284) — USS Theodore Roosevelt, April 2020 (June 2020)
Graphic source: https://www.cdc.gov/mmwr/volumes/69/wr/mm6923e4.htm
Graphic source: https://int.nyt.com/data/documenthelper/6926-mayhhsbriefing/af7319f4a55fd0ce5dc9/optimized/full.pdf#page=1
Updated CDC COVID-19 symptom list (4/27/2020)
Graphic source: https://heavy.com/news/2020/04/early-symptoms-coronavirus-covid-19/
General
Conjunctivitis
Dermatological Manifestations
Hearing Loss
Loss of Smell
Graphic source: https://pubs.acs.org/doi/full/10.1021/acschemneuro.0c00210#
AAO-HNS: Anosmia, Hyposmia, and Dysgeusia Symptoms of Coronavirus Disease 3/2020 About Half of COVID-19 Cases Show Digestive Signs 3/2020 Alterations in Smell or Taste in Mildly Symptomatic Outpatients With SARS-CoV-2 Infection 4/2020 Anosmia Can Warn Us of More Than Just COVID - Sense of smell is deeply connected with cognitive function 8/2021 Another Presenting Sign of COVID-19 - Findings support adding to the list of GI manifestations of the disease, researchers say 8/2020 Chinese Study: Some Mild COVID-19 Cases Have Only GI Symptoms About 19% with digestive issues experienced diarrhea as the first symptom of COVID-19 4/2020 Coronavirus symptoms: What are they and how do I protect myself? BBC.com 6/2020 COVID-19 and a loss of smell: Why the virus may hinder this sense. A loss of smell can be caused by nasal congestion. But it happens in COVID-19 patients even without a stuffed-up nose. 8/2020 Diarrhea is first sign of illness for some COVID-19 patients 3/2020 Expression of the SARS-CoV-2 Entry Proteins, ACE2 and TMPRSS2, in Cells of the Olfactory Epithelium: Identification of Cell Types and Trends with Age 5/2020 From Loss Of Smell To 'COVID Toes': What Experts Are Learning About Symptoms 5/2020 GI and Hepatic Symptoms Call for COVID-19 Testing. Liver injury, in particular, could lead to poor clinical outcomes 5/2020 How COVID-19 Causes Loss of Smell 7/2020 Inflamed brains, toe rashes, strokes: Why COVID-19's weirdest symptoms are only emerging now 5/2020 Little Known About COVID Patients' Loss of Smell 4/2020 Lost Sense of Smell May Be Peculiar Clue to Coronavirus Infection 3/2020 Mysteries of COVID Smell Loss Finally Yield Some Answers. Explanations begin to arise at the molecular level for this vexing but commonplace symptom 11/2020 Skin Rashes: An Emerging Symptom of COVID-19: What clinicians need to know about cutaneous manifestations of COVID-19 4/2020 Smell and taste changes provide early indication of COVID-19 community spread 11/2020 Smell and Taste Issues Unlikely to Linger After COVID-19 7/2020 Smell Diminishes by Day 3 of COVID-19, Study Says 5/2020
Sniffing Out Where Virus First Strikes in COVID-19 - More context for why COVID-19 patients might lose sense of smell 8/2020 Symptom tracker app reveals six distinct types of COVID-19 infection 7/2020 What are COVID toes? Dermatologists, podiatrists share strange findings 3/2020 What it's like to suffer from the coronavirus's weirdest symptom 4/2020 What are the symptoms of COVID-19 What Is Covid Toe? 5/2020 Maybe a Strange Sign of Coronavirus Infection Dermatologists say the lesions should prompt testing for the virus, even though many patients have no other symptoms
Psychiatric Symptoms
Sleep Deprivation
Back to Table of Contents
TRANSMISSION
COVID-19 Transmission Transmission Routes
Graphic source: https://drive.google.com/drive/folders/1E5KJv7kAgoOF5alG5Oe6xRLJvA91vzsG
Video source: https://twitter.com/CDCgov/status/1484277054162055175
Graphic source: https://www.nature.com/articles/s41591-020-1092-0/figures/2
SARS-CoV-2 introductions to U.S. and Europe. Credit: Modified from Worobey M, Science, 2020.
Graphic source: https://pubmed.ncbi.nlm.nih.gov/32912998/
Graphic source: https://www.nejm.org/doi/full/10.1056/NEJMcp2009249
Current Sites of COVID-19 cases
Graphic source: https://jamanetwork.com/journals/jamanetworkopen/fullarticle/2767010
Potential Sites for future COVID-19 cases
Graphic source: https://jamanetwork.com/journals/jamanetworkopen/fullarticle/2767010
Reproduction Number
"To determine when an outbreak had been contained, scientists look at case counts and determine the reproduction number, a measurement that shows how many people will be infected by one infectious person. If the reproduction number drops below 1, scientists consider the outbreak contained."
Graphic source: https://www.mckinsey.com/industries/healthcare-systems-and-services/our-insights/when-will-the-covid-19-pandemic-end?cid=other-eml-alt-mip-mck
Graphic source: https://www.visualcapitalist.com/history-of-pandemics-deadliest/
Graphic source: @fperrywilson
Graphic source: https://www.mckinsey.com/business-functions/risk/our-insights/covid-19-implications-for-business
R-naught - the theory R-naught - the reality of superspreaders
Source: https://www.nytimes.com/2020/05/22/well/live/coronavirus-pandemic-memorial-day-picnics-bbqs.html
Graphic source: https://www.cnn.com/2020/10/06/health/flu-covid-19-deaths-comparison-trnd/index.html
Graphic source: https://www.cdc.gov/mmwr/volumes/69/wr/mm6926e1.htm
Graphic source: https://www.zdnet.com/article/google-researchers-show-how-covid-19-super-spreaders-are-a-big-part-of-the-problem/">
Reich and colleagues show that even for the same "R," transmission rate, on average, infections can rise faster with a higher "gamma," the measure of how many "degrees" of contacts a person in the society has -- the super-spreaders.
Graphic source: https://cosmosmagazine.com/biology/measuring-different-responses-to-covid-19
Graphic source; https://www.vox.com/2020/1/28/21079946/coronavirus-china-wuhan-deaths-pandemic
Graphic source: https://www.nationalgeographic.com/science/2020/05/coronavirus-how-to-measure-your-nation-response-cvd/"
Back to Table of Contents
Asymptomatic/Pre-symptomatic (Silent Spreader/Stealth) Transmission)
Graphic source: https://www.nejm.org/doi/full/10.1056/NEJMc2001468
Graphic source: https://www.cdc.gov/mmwr/volumes/69/wr/mm6923e4.htm
Study: Kids with COVID but no symptoms play key role in household spread 3/2024 About 80% of Asymptomatic People With COVID-19 Develop Symptoms 9/2020 A common allele of HLA is associated with asymptomatic SARS-CoV-2 infection 7/2023 An enduring coronavirus mystery: Why do only some get sick? 6/2020. Months into a pandemic that has killed nearly 500,000 people worldwide, scientists are still trying to answer crucial questions about the coronavirus. As many as 45% of people infected with COVID-19 have no symptoms, and they may play a major role in the spread of the virus, according to a new study. 6/2020 Asymptomatic and Presymptomatic SARS-CoV-2 Infections in Residents of a Long-Term Care Skilled Nursing Facility - King County, Washington, March 2020 MMWR 3/2020 Asymptomatic coronavirus infections contribute to over 50% of spread, according to UChicago study 5/2021 Asymptomatic COVID-19 cases may be more common than suspected The problem? Even without symptoms, people can still spread the virus. 5/2020 Asymptomatic COVID: Silent, but Maybe Not Harmless 8/2020 Asymptomatic COVID-19 Transmission in China Confirmed? 2/2020 Asymptomatic spread makes testing key for COVID-19 fight 5/2020 Asymptomatic people may be fueling the coronavirus spread 4/2020 Capturing hidden data for asymptomatic COVID-19 cases provides a better pandemic picture. Measuring the disease spread poses a challenge when not all carriers show it 2/2022 Clinical Course and Molecular Viral Shedding Among Asymptomatic and Symptomatic Patients With SARS-CoV-2 Infection in a Community Treatment Center in the Republic of Korea 8/2020 Even Asymptomatic People Carry the Coronavirus in High Amounts. Researchers in South Korea found that roughly 30 percent of those infected never develop symptoms yet probably spread the virus. 8/2020 Coronavirus disease 2019 (COVID-19) Situation Report 73 Pre-symptomatic and Presymptomatic transmission April 3, 2020 WHO.int Coronavirus may be most infectious when symptoms are mildest, small study finds 4/2020 Coronavirus Spreads Quickly and Sometimes Before People Have Symptoms, Study Finds 3/2020 Coronavirus spreads quickly and sometimes before people have symptoms, study finds 3/2020 Covert coronavirus infections could be seeding new outbreaks 3/2020 Covid-19: Four in 10 cases in Italian town that locked down early were asymptomatic 7/2020 COVID-19: in the footsteps of Ernest Shackleton 5/2020 Cruise ship 81% asymptomatic! COVID-19 spread is fueled by 'stealth transmission'. Cases of COVID-19 that fly under the radar without being diagnosed appear to fuel the rapid spread of the disease. 3/2020 Did you already have coronavirus in January or February? 4/2020 Estimating the generation interval for coronavirus disease (COVID-19) based on symptom onset data, March 2020 4/2020 Even children with no symptoms can spread Covid-19, CDC report shows 9/2020 Half of Singapore's new COVID-19 cases are symptomless, taskforce head says 6/2020 Hidden Outbreaks Spread Through U.S. Cities Far Earlier Than Americans Knew, Estimates Say 5/2020 Household Transmission Dynamics of Asymptomatic SARS-CoV-2–Infected Children: A Multinational, Controlled Case-Ascertained Prospective Study 3/2024 Academic.oup.com How COVID Silent Spreaders May Be Infecting Others 4/2020 How does the new coronavirus spread? These new studies offer clues. 3/2020 How many COVID-19 infections are asymptomatic? Research shows it may be a lot more than thought 7/2020 How much is coronavirus spreading under the radar? 3/2020 How Stealth transmission is fueling the rapid spread of Covid-19, according to experts 3/2020 How the World Missed Covid-19's Silent Spread 6/2020 How to identify factors affecting COVID-19 transmission 3/2020 Indirect Virus Transmission in Cluster of COVID-19 Cases, Wenzhou, China, 2020 6/2020 Infected but Feeling Fine: The Unwitting Coronavirus Spreaders 4/2020 Infected people without symptoms might be driving the spread of coronavirus more than we realized 3/2020 In four US prisons, thousands of inmates are testing positive and 96% are asymptomatic 4/2020 In the W.H.O.'s Coronavirus Stumbles, Some Scientists See a Pattern 6/2020 It's not just people with symptoms who can spread COVID-19 3/2020 Magnitude of asymptomatic COVID-19 cases throughout the course of infection: A systematic review and meta-analysis 3/2021 More Evidence Points to Kids Being COVID-19 'Silent Spreaders' Study: 93% of infections would have been missed if only symptomatic cases were tested 8/2020 Most COVID-19 Cases Come from People Without Symptoms 1/2021 Most COVID Transmission Is Still Asymptomatic
— Some 60% of spread starts with those who have no symptoms, and that may be higher with Omicron 5/2022 New Study Says Silent Spreaders May Be Responsible For Half Of U.S. COVID-19 Cases 7/2020 Over 85% of COVID-19 Infections in China Went Undetected Early On 3/2020. Number of mild or asymptomatic infections emphasizes need for mitigation measures People might be most infectious with coronavirus before they show symptoms, study suggests 4/2020 Predominant airborne transmission and insignificant fomite transmission of SARS-CoV-2 in a two-bus COVID-19 outbreak originating from the same pre-symptomatic index case 3/2022 Presymptomatic SARS-CoV-2 Infections and Transmission in a Skilled Nursing Facility 5/2020 NEJM Presymptomatic Transmission of SARS-CoV-2 -Singapore, January 23-March 16, 2020 4/2020 MMWR Prevalence of Asymptomatic SARS-CoV-2 Infection A Narrative Review 6/2020 Rapid spread of COVID-19 is fueled by 'stealth transmission' 3/2020 SARS-CoV-2 Infections and Serologic Responses from a Sample of U.S. Navy Service Members, USS Theodore Roosevelt, April 2020 6/2020 SARS-CoV-2 Transmission From People Without COVID-19 Symptoms 1/2021 JAMA South Korean Study Suggests Children Can Silently Spread COVID-19; Symptoms went unrecognized more often than not in infected kids 9/2020 'Stealth Transmission' Fuels Fast Spread of Coronavirus Outbreak 3/2020 Study: 17.9% Of People With COVID-19 Coronavirus Had No Symptoms 3/2020 Substantial Undocumented Infection Facilitates the Rapid Dissemination of Novel Coronavirus (SARS-CoV2) 3/2020 The natural history and transmission potential of asymptomatic SARS-CoV-2 infection 6/2020 The truth about COVID-19 and asymptomatic spread: It's common, so wear a mask and avoid large gatherings 11/2020 Transmission of 2019-nCoV Infection from an Asymptomatic Contact in Germany 3/2020 NEJM We Still Don't Fully Understand The Label 'Asymptomatic' 6/2020 What Does Asymptomatic COVID-19 Look Like Under the Surface? Many individuals show subclinical abnormalities as well as differences from symptomatic patients 6/2020 What We Know About The Silent Spreaders Of COVID-19 4/2020 What We Need to Understand About Asymptomatic Carriers if We're Going to Beat Coronavirus 4/2020 WHO Creates 'Confusion' About Asymptomatic Spread. Here's What We Know 6/2020 WHO Says Asymptomatic Spread Of Coronavirus 'Very Rare,' But Experts Raise Questions 6/2020 Wuhan woman with no symptoms infects five relatives with coronavirus: study 2/2020
Back to Table of Contents
Superspreader Events (SSEs)
Graphic source: https://www.thelancet.com/journals/laninf/article/PIIS1473-3099(23)00183-4/fulltext
Graphic source: https://www.cdc.gov/mmwr/volumes/70/wr/mm7035e2.htm
Graphic source: https://www.mckinsey.com/featured-insights/coronavirus-leading-through-the-crisis/charting-the-path-to-the-next-normal/people-who-see-people-how-high-mixers-help-spread-covid-19
Graphic source:
https://public.tableau.com/profile/betsy.ladyzhets#!/vizhome/superspreadingevents/DashSuperspreadingeventsmap
Graphic source: https://www.cdc.gov/mmwr/volumes/69/wr/mm6947e1.htm
Distribution of COVID-19 cases (N = 177) linked to a rural wedding reception, by date of onset or test - Maine, August 7–September 14, 2020
Graphic source: https://www.cdc.gov/mmwr/volumes/69/wr/mm6945a5.htm
Graphic source: https://www.cdc.gov/mmwr/volumes/69/wr/mm6945a5.htm
Graphic source: https://news.mit.edu/2020/super-spreading-covid-transmission-1102
Graphic source: https://www.cdc.gov/mmwr/volumes/69/wr/mm6941a4.htm
Transmission chains and attack rates in three COVID-19 child care facility outbreaks, Salt Lake County, Utah, April 1-July 10, 2020
Graphic source: https://www.dailymail.co.uk/news/article-8094933/How-one-man-spread-coronavirus-NINE-people-bus.html
Graphic source: https://www.nytimes.com/2020/04/20/health/airflow-coronavirus-restaurants.html
Chinese Restaurant transmission
Graphic source: https://www.cdc.gov/mmwr/volumes/69/wr/mm6915e1.htm
Funeral community transmission
CDC - Korean Call Center - Blue = infected with COVID-19
Graphic source: https://www.vox.com/21262268/coronavirus-tips-covid-social-distancing-harm-reduction
Graphic source: https://www.cdc.gov/mmwr/volumes/69/wr/mm6920e2.htm
Graphic source: https://www.statista.com/chart/21699/coronavirus-outbreak-in-ischgl/"
Graphic source: https://www.statista.com/chart/21697/contact-tracing-response-seoul-south-korea-covid-19/
Graphic source: https://www.zdnet.com/article/google-researchers-show-how-covid-19-super-spreaders-are-a-big-part-of-the-problem/
Reich and colleagues construct graphs of people in their various states of infection and the like among people, to simulate how COVID-19 spreads. Caption from the article: "Contact tracing. Some share of the neighbors of a node which tests positive are traced and tested themselves." Reich et al. 2020
Graphic source: https://cosmosmagazine.com/biology/how-social-distancing-flattens-the-curve-of-coronavirus
This graph shows how an epidemic might spread across a network over time. Blue dots are susceptible individuals, while red dots are infected people. Two dots are connected by a line if they are in contact with each other, and the more contacts a person has, the bigger their dot is on the network. Author provided
Infected people are red nodes, and susceptible people are blue. The large node in the middle of the diagram is a super-spreader, a person who connects with many others, and thus has more potential to spread the disease.
Graphic source: https://quillette.com/2020/04/23/covid-19-superspreader-events-in-28-countries-critical-patterns-and-lessons/
Timeline of events and symptom onsets, by day of investigation, in a cluster of COVID-19 likely transmitted at two family gatherings - Chicago, Illinois, February-March 2020
Video source: https://www.nytimes.com/2020/04/14/us/coronavirus-updates.html
Super-spreaders: a historical review 6/2023 After Lavish Nights of Clubbing in Bangkok, a Covid Outbreak. Thailand went for months without a single confirmed case of local transmission, but the epidemic has now radiated from nightclubs to areas where social distancing is all but impossible. 6/2021 A large COVID-19 outbreak in a high school 10 days after schools' reopening, Israel, May 2020 7/2020 An Outbreak of COVID-19 Associated with a Recreational Hockey Game - Florida, June 2020 MMWR 10/2020 A person who was Covid-19 positive attended a church service and exposed 180 people 5/2020 Bars, Strip Clubs and Churches: U.S. Virus Outbreaks Enter Unwieldy Phase 6/2020 Clustering and superspreading potential of SARS-CoV-2 infections in Hong Kong 10/2020 Clusters of Coronavirus Disease in Communities, Japan, January-April 2020 6/2020 College towns fear super-spreader semester as students descend 8/2020 Community Transmission of SARS-CoV-2 at Two Family Gatherings Chicago, Illinois, February-March 2020 4/2020 Coronavirus Cluster on Cape Cod: 10 Test Positive After Attending Large Party 7/2020 Coronavirus outbreak at USC's fraternity row leaves at least 40 people infected 7/2020 Coronavirus Ravaged a Choir. But Isolation Helped Contain It. 5/2020 Coronavirus Testing In Boston's Homeless Community Shows Shelter Size And Density Matter 5/2020
COVID-19 Outbreak Among a University's Men's and Women's Soccer Teams - Chicago, Illinois, July-August 2020 MMWR 10/2020 COVID-19 Outbreak Among College Students After a Spring Break Trip to Mexico Austin, Texas, March 26-April 5, 2020 MMWR 7/2020
COVID-19 Outbreak Associated with a 10-Day Motorcycle Rally in a Neighboring State - Minnesota, August-September 2020 MMWR 11/2020 Covid-19 superspreader events emerge as focus of concern. The White House cluster is the kind of incident that infectious disease experts are focusing on as a crucial way to understand how the coronavirus spreads. 10/2020 COVID-19 Superspreader Events in 28 Countries: Critical Patterns and Lessons 4/2020 Covid-19 "super-spreading" events play outsized role in overall disease transmission 11/2020 Days After a Funeral in a Georgia Town, Coronavirus Hit Like a Bomb 6/2020. A mourner came to Albany, Ga., to attend the funeral of a retired janitor. After a pause while the infections incubated, the virus swept through the community. Dozens of persons in Shinjuku's sex industry infected with coronavirus 4/2020 Epidemiologically Linked COVID-19 Outbreaks at a Youth Camp and Men's Conference - Illinois, June-July 2021 8/2021 MMWR Epidemiology and transmission dynamics of COVID-19 in two Indian states 9/2020 Ford temporarily closed its Chicago Assembly Plant after two employees test positive for COVID-19 a day after reopening 5/2020 Google researchers: COVID-19 super-spreaders are a big part of the problem 5/2020 Greenwich & Darien Deal With Coronavirus 'Party Zero'-Type Cases 8/2020 High COVID-19 Attack Rate Among Attendees at Events at a Church, Arkansas, March 2020 5/2020
High SARS-CoV-2 Attack Rate Following Exposure at a Choir Practice — Skagit County, Washington, March 2020 5/2020 MMWR Hospital Traces COVID Cluster to Break Room - 15 employees of Holyoke Medical Center fall ill after eating together 10/2020 How a Bus Ride Turned Into a Coronavirus Superspreader Event. One-third of passengers aboard a bus were infected by a fellow passenger, scientists reported. 9/2020 How a Premier U.S. Drug Company Became a Virus Super Spreader Biogen employees unwittingly spread the coronavirus from Massachusetts to Indiana, Tennessee and North Carolina. 4/2020 NYT How a superspreader at choir practice sickened 52 people with COVID-19 5/2020 How Coronavirus Infected Some, but Not All, in a Restaurant, A limited study by Chinese researchers suggests the role played by air currents in spreading the illness in enclosed spaces. 4/2020 How Ischgl Set Off A Coronavirus Avalanche 5/2020 How large superspreader events turned into coronavirus hot spots. This is why large gatherings should be the last normal activity to come back after Covid-19 is contained. 5/2020 How one man spread coronavirus to NINE other people on his bus in China: Scientists find the deadly virus can travel four times the 'safe' distance and linger in the air for over 30 minutes in confined places 3/2020 How Superspreading Events Drive Most COVID-19 Spread. 6/2020, As few as 10 percent of infected people may drive a whopping 80 percent of cases, in specific types of situations Intense fitness classes can lead to rapid spread of COVID-19, report shows 5/2020 Lamont Warns Of Possible Coronavirus Spread At Parties. The parties mainly took place in Fairfield County. One involved people sharing a vape pen, Lamont said. 7/2020 Maine CDC Investigates COVID-19 Outbreak Associated with Wedding Reception in Millinocket 8/2020 More Than 6,600 Coronavirus Cases Have Been Linked to U.S. Colleges 7/2020 Most People With Coronavirus Won't Spread It. Why Do a Few Infect Many? 6/2020
Multiple COVID-19 Outbreaks Linked to a Wedding Reception in Rural Maine - August 7-September 14, 2020 MMWR 11/2020 One Infected Clubgoer Triggers Massive Response 5/2020 Outbreak Associated with SARS-CoV-2 B.1.617.2 (Delta) Variant in an Elementary School - Marin County, California, May-June 2021 8/2021 MMWR Party with 400 people shut down during students' first weekend back at ECU, cops say 8/2020 Party Zero: How a Soiree in Connecticut Became a Super Spreader 3/2020 NYT People who see people: How high mixers help spread COVID-19 4/2021 Police Tactics Are Putting Protesters at Higher COVID Transmission Risk. 6/2020. Cops are forgoing masks and other PPE, and violating protesters' boundaries by pulling masks down, forcing them into crowded spaces, and more. Protests Pose Particular Risks for COVID-19 Transmission. 6/2020. Not just lack of social distancing, but increased droplet contact, tear gas could be factors Rose Garden announcement of Supreme Court nominee potential 'super spreader' event, with Trump plus six others getting COVID 10/2020 SARS-CoV-2 Transmission and Infection Among Attendees of an Overnight Camp - Georgia, June 2020 MMWR 7/2020 Spring Breaker Who Vowed To Party Despite Coronavirus Concerns Has Apologized 3/2020 Superspreading and the effect of individual variation on disease emergence 11/2005 Superspreading, overdispersion and their implications in the SARS-CoV-2 (COVID-19) pandemic: a systematic review and meta-analysis of the literature 5/2023 The Coronavirus Infected Hundreds at a Georgia Summer Camp 7/2020 The Coronavirus's Rampage Through a Suburban Nursing Home 3/2020 NYT The Effects of Large Group Meetings on the Spread of COVID-19: The Case of Trump Rallies 10/2020 Abstract The Effects of Large Group Meetings on the Spread of COVID-19: The Case of Trump Rallies 10/2020 Article Tracking Covid-19 infections among President Trump's contacts. What we know about the Covid-19 status of those who have been around the president recently. 10/2020 Tracing Trump's movements: A timeline of the days leading up to his COVID diagnosis. A review of his public schedule shows several possible "super-spreader" events. 10/2020 Two churches reclose after faith leaders and congregants get coronavirus 5/2020 What's A 'Super-Spreading Event'? And Has It Happened With COVID-19? 2/2020 What counts as a 'superspreader' event? 1o/2020 What makes a COVID superspreader? Scientists learn more after deliberately infecting volunteers
A rigorous study identifies ‘supershedders’ who spew huge amounts of virus into the air — despite having only mild symptoms. 6/2023 With the holidays coming, Covid cases likely to surge during 'six weeks of superspreader events' 10/2020 Why Are Some People So Much More Infectious Than Others? 4/2020 Why COVID-19 Flare-Ups Will Keep Happening 5/2020 Why understanding superspreaders is key to controlling COVID-19 PBS.org Younger adults are biggest spreaders of Covid-19, study suggests 2/2021
Back to Table of Contents
Transmission Factors
6 - Aerosols and Transmission of Respiratory Viruses 101 by Linsey Marr from The National Academies on Vimeo .
Just because you don't have any symptoms does not mean you are not infectious
Graphic source: https://twitter.com/luckytran/status/1764076970533396495/photo/1
Graphic source: https://www.nature.com/articles/s41579-022-00822-w
Graphic source: https://twitter.com/EricTopol/status/1763981007773155413
Graphic source: https://www.bmj.com/content/375/bmj-2021-065312
Graphic source: https://academic.oup.com/cid/advance-article/doi/10.1093/cid/ciaa1442/5910315
Graphic source: https://academic.oup.com/cid/advance-article/doi/10.1093/cid/ciaa1442/5910315
Graphic source: https://jamanetwork.com/journals/jamanetworkopen/fullarticle/2767010
Graphic source: https://www.nature.com/articles/s41591-020-0869-5
a, Schematic of the relation between different time periods in the transmission of infectious disease. b, Human-to-human transmission pairs of SAR-CoV-2 virus (N=77). We assumed a maximum exposure window of 21 days prior to symptom onset of the secondary cases. Detailed information on the transmission pairs and the source of information is summarized in Supplementary Tables 2 and 3. c, Estimated serial interval distribution (top), inferred infectiousness profile (middle) and assumed incubation period (bottom) of COVID-19.
Graphic source: https://www.nature.com/articles/s41591-020-0869-5
Viral load (threshold cycle (Ct) values) detected by RT-PCR (PCR with reverse transcription) in throat swabs from patients infected with SARS-CoV-2 (N=94), overall and stratified by disease severity, sex, age group and link to Hubei province. The detection limit was Ct40, which was used to indicate negative samples. The thick lines show the trend in viral load, using smoothing splines. We added some noise to the data points to avoid overlaps.
Back to Table of Contents
Air (Airborne)Transmission
VIDEO
From Pri-Med April 5, 2025.
VIDEO
6 - Aerosols and Transmission of Respiratory Viruses 101 by Linsey Marr from The National Academies on Vimeo .
VIDEO
Video Source: https://twitter.com/NjbBari3/status/1617100023136931841
Video Source: https://twitter.com/nytimes/status/1383871010617757703
VIDEO
Infected after 5 minutes, from 20 feet away: South Korea study shows coronavirus’ spread indoors
Evolution of a Cough
Graphic source: https://www.mcgill.ca/newsroom/channels/news/covid-19-without-masks-two-metres-distancing-not-enough-333819
Evolution of a cough with mask
Graphic source: https://www.mcgill.ca/newsroom/channels/news/covid-19-without-masks-two-metres-distancing-not-enough-333819
Graphic source:
https://www.youtube.com/watch?v=i7e8t-Rzv0I
Graphic source: https://wwwnc.cdc.gov/eid/article/27/6/21-0465-f2
Graphic source: https://www.latimes.com/world-nation/story/2020-12-09/five-minutes-from-20-feet-away-south-korean-study-shows-perils-of-indoor-dining-for-covid-19
Graphic source: @ncdhhs
Graphic source: https://www.nationalgeographic.com/science/2020/08/how-to-measure-risk-airborne-coronavirus-your-office-classroom-bus-ride-cvd/
Graphic source: https://www.nationalgeographic.com/science/2020/08/how-to-measure-risk-airborne-coronavirus-your-office-classroom-bus-ride-cvd/
Graphic source: https://twitter.com/tukkerloo/status/1237078414416281605
Graphic source: https://www.sciencedirect.com/science/article/pii/S016041202031254X?via%3Dihub
Graphic source:
https://cosmosmagazine.com/science/physics/heres-why-you-should-close-the-toilet-lid/
Left: Vortex caused by common annular flushing. Right: Large-scale spread of virus particles after flushing. Credit: J-X Wang
Graphic source: https://boston.cbslocal.com/2020/05/12/coronavirus-spread-restaurant-airflow-erin-bromage/
Graphic shows how coronavirus spreads through air (Image credit University of Oregon)
Graphic source: https://api.nationalgeographic.com/distribution/public/amp/science/2020/01/how-coronavirus-spreads-on-a-plane
Peak risk of SARS-CoV-2 infection within 5 s of face-to-face encounters: an observational/retrospective study 10/2023 Infectivity of exhaled SARS-CoV-2 aerosols is sufficient to transmit covid-19 within minutes 12/2023 COVID patients exhale up to 1,000 copies of virus per minute during first eight days of symptoms
First direct measure of SARS-CoV-2 viral copies exhaled over course of infection 9/2023 Ten scientific reasons in support of airborne transmission of SARS-CoV-2 5/2021 Lancet Airborne Toxic Events 3/2022 Respiratory droplets 2009 Let’s Clear The Air On COVID 3/23/2022 The White House US, WHO officials and experts agree (sort of) on how COVID-19 spreads 4/2022 A case study of extended in-flight transmission of SARS-CoV-2 en route to Aotearoa New Zealand 11/2020 Aerosol and Surface Stability of SARS-CoV-2 as Compared with SARS-CoV-1 3/2020 ,/B> Aerosols from speaking can linger in the air for up to nine hours 11/2021 NIH.gov Aerosol particle emission increases exponentially above moderate exercise intensity resulting in superemission during maximal exercise 5/2022
Concordance of SARS-CoV-2 RNA in Aerosols From a Nurses Station and in Nurses and Patients During a Hospital Ward Outbreak 6/2022 JAMA Network Here's How a Virus Moves in a Crowd so You Can Avoid It 9/2022 WebMD Identifying airborne transmission as the dominant route for the spread of COVID-19 6/2020 It Is Time to Address Airborne Transmission of Coronavirus Disease 2019 (COVID-19) 6/2020 Modelling the dynamic relationship between spread of infection and observed crowd movement patterns at large scale events 9/2022 Nature.com Mounting evidence suggests coronavirus is airborne — but health advice has not caught up 7/2020
Outbreak of Coronavirus Disease 2019 (COVID-19) in a Nursing Home Associated With Aerosol Transmission as a Result of Inadequate Ventilation 8/2020 SARS-CoV-2 transmission on planes 4/2022 Scientific Brief: SARS-CoV-2 Transmission CDC.gov 5/2021 Ways COVID-19 Spreads CDC.gov 5/2021 The virus is an airborne threat, the C.D.C. acknowledges. 5/2021 Updated CDC guidance acknowledges coronavirus can spread through the air 9/2020 CDC finally acknowledges airborne COVID-19 spread, for real this time 10/2020 COVID-19: Without masks, two metres distancing is not enough 10/2021
COVID-19: Without masks, two meters distancing is not enough, research finds. Simulations track the spread of coughs and safe physical distancing indoors 10/2021 COVID Spread More Indoors by Talking Than Coughing, Study Suggests 1/2021 COVID-19 Is Transmitted Through Aerosols. We Have Enough Evidence, Now It Is Time to Act 8/2020 Droplets vs Aerosols: What's More Important in COVID-19 Spread? CDC finally acknowledged aerosol transmission, but contribution to case counts remains unclear 5/2021 Efforts to stop spread of COVID-19 should focus on preventing airborne transmission, experts say 4/2021 Epidemiologic Evidence for Airborne Transmission of SARS-CoV-2 during Church Singing, Australia, 2020 6/2021 Fate and Transport of Indoor Microbiological Aerosols (FaTIMA) Web tool
Excel fatima-csv-template Fate and Transport of Indoor Microbiological Aerosols (FaTIMA) Flushing a public toilet? Don't linger, because aerosolized droplets do. Study explores flushing power to test risk of COVID-19 transmission 4/2021 Probable Aerosol Transmission of SARS-CoV-2 through Floors and Walls of Quarantine Hotel, Taiwan, 2021 12/2022 CDC.gov Simple safety measures reduce musical COVID-19 transmission 8/2021 6 feet may not be enough to avoid infectious aerosols indoors 9/2021 Transmission of Viruses in Droplets and Aerosols (part 1) Transmission of Viruses in Droplets and Aerosols (part 2) Transmission of Viruses in Droplets and Aerosols (part 3) Transmission of Viruses in Droplets and Aerosols (Part 4) Youtube 239 Experts With One Big Claim: The Coronavirus Is Airborne 7/2020 Aboard the Diamond Princess, a Case Study in Aerosol Transmission. A computer model of the cruise-ship outbreak found that the virus spread most readily in microscopic droplets light enough to linger in the air. 7/2020
Aerodynamic analysis of SARS-CoV-2 in two Wuhan hospitals 4/2020 Aerosol and Surface Distribution of Severe Acute Respiratory Syndrome Coronavirus 2 in Hospital Wards, Wuhan, China, 2020 4/2020 Aerosol and Surface Stability of SARS-CoV-2 as Compared with SARS-CoV-1 3/2020 Aerosol Scientist: COVID-19 Is Likely Airborne 6/2020 Airborne Coronavirus Detected in Wuhan Hospitals 5/2020 Airborne Spread of SARS-CoV-2 and a Potential Role for Air Disinfection 6/2020 JAMA Airborne Transmission of SARS-CoV-2. Theoretical Considerations and Available Evidence 7/2020 JAMA Airborne transmission of SARS-CoV-2: The world should face the reality 6/2020 Airborne Coronavirus: What You Should Do Now 7/2020 Airborne viruses can spread on dust, non-respiratory particles 8/2020 Can the coronavirus spread through speech? 4/2020 CDC: COVID-19 Can Spread 13 Feet, Travel on Shoes; 4/2020 Coronavirus can travel twice as far as official safe distance and stay in air for 30 minutes, Chinese study finds 3/2020 SCMP.com Coronavirus Lingers in Air of Crowded Spaces, New Study Finds 4/2020 Coughs and sneezes travel farther than you think via @YouTube COVID-19 may spread through breathing and talking but we don't know how much. 4/2020 Speech-related spread could help explain why people can spread the virus before they develop a cough. COVID-19 Outbreak Associated with Air Conditioning in Restaurant, Guangzhou, China, 2020 7/2020 (Released 4/2020) Covid-19 spreads through the air. That is a big challenge for reopening 6/2020 Covid Is Airborne, Scientists Say. Now Authorities Think So, Too 5/2021 Everything You Wanted to Know About Air Purifiers and Coronavirus 11/2020 Here's how coronavirus spreads on a plane and the safest place to sit. Global travel opens new roads for outbreaks, like coronavirus and the flu but which is more dangerous, and how can you stay safe? 3/2020 NATGEO How airflow inside your car affects COVID-19 risk 12/2020 How Coronavirus Infected Some, but Not All, in a Restaurant A limited study by Chinese researchers suggests the role played by air currents in spreading the illness in enclosed spaces. 4/2020 How Did We Get Here: What Are Droplets and Aerosols and How Far Do They Go? A Historical Perspective on the Transmission of Respiratory Infectious Diseases 5/2021 How far can SARS-CoV-2 travel into the airways? A mathematical model shows it reaches deep into our lungs, and more to the right than the left. 6/2021 How Important Is Speech in Transmitting Coronavirus? 3/2020 ucdavis.edu How important is speech in transmitting coronavirus? 4/2020 How To Protect Yourself From Coronavirus That Can Linger In The Air 9/2020 Infected after 5 minutes, from 20 feet away: South Korea study shows coronavirus spread indoors 12/2020 Infectious particles of the SARS-CoV-2 virus isolated from hospital air 4/2023 It is Time to Address Airborne Transmission of COVID-19 7/2020 Is COVID-19 spread through the air? 7/2020.
Scientists say there's mounting evidence it can be. Measure the risk of airborne COVID-19 in your office, classroom, or bus ride 8/2020 Model: Face Masks Prevented Thousands of COVID-19 Cases. Researchers argue airborne transmission "dominant route for infection" 6/2020 Mounting Evidence Suggests Coronavirus Is Airborne but Health Advice Has Not Caught Up 7/2020 People are getting sick from coronavirus spreading through the air – and that's a big challenge for reopening 6/2020 Playing wind instruments generates less aerosol than vocalization, COVID-19 study finds 6/2021 Researchers link 'heavy wildfire smoke' in Reno to increased risk of contracting COVID-19 7/2021 Scientists Urge WHO To Update Guidance On Airborne Transmission Of The Coronavirus 7/2020 NPR 6 feet may not keep musicians safe during the pandemic 10/2020 Stay 6 Feet Apart, We're Told. But How Far Can Air Carry Coronavirus? Most of the big droplets travel a mere six feet. The role of tiny aerosols is the trillion-dollar question. 4/2020 Talking Can Generate Coronavirus Droplets That Linger Up to 14 Minutes 5/2020 The Coronavirus Is Airborne Indoors. Why Are We Still Scrubbing Surfaces? 11/2020 The airborne lifetime of small speech droplets and their potential importance in SARS-CoV-2 transmission 5/2020 The Coronavirus Can Be Airborne Indoors, W.H.O. Says 7/2020 The Coronavirus May Be Adrift in Indoor Air, C.D.C. Acknowledges 10/2020 The Flu May Linger in the Air, Just Like the Coronavirus 7/2020 The Scientist, the Air and the Virus 6/2020
The Shifting Paradigm of COVID-19 Airborne Transmission; Expert panel points to "circumstantial evidence," though research is evolving 8/2020 The 60-Year-Old Scientific Screwup That Helped Covid Kill. All pandemic long, scientists brawled over how the virus spreads. Droplets! No, aerosols! At the heart of the fight was a teensy error with huge consequences. 5/2021 Tree pollen carries SARS-CoV-2 particles farther, facilitates virus spread, study finds 6/2021 Turbulent Gas Clouds and Respiratory Pathogen Emissions - Potential Implications for Reducing Transmission of COVID-19 3/2020 Two meters distance might not be enough to avoid the spread of COVID-19 Social distance is important but also sneeze and cough etiquette 4/2020 Using a public restroom? Mask up! Flushing public restroom toilets or urinals can spew clouds of particles carrying viruses, including COVID-19 8/2020 Violent expiratory events: on coughing and sneezing 2/2014 Viral Load of SARS-CoV-2 in Respiratory Aerosols Emitted by COVID-19 Patients while Breathing, Talking, and Singing 8/2021 We Know Crowding Affects the Spread. It May Affect the Death Rate. Densely populated areas can have nearly twice the rate of transmission, and can make Covid-19 more deadly. Other areas can open more quickly. 4/2020 What airborne coronavirus means, and how to protect yourself
The COVID-19 pandemic has revived a decades-old debate about how respiratory diseases travel which affects the safety practices experts recommend. 8/2020 What is airborne transmission? WHO adds guidance on aerosols in coronavirus spread 7/2020 What We Know About Your Chances of Catching the Virus Outdoors 5/2020 What were the historical reasons for the resistance to recognizing airborne transmission during the COVID-19 pandemic? 8/2022 When you cough, how far can it go? Physics suggests we should be distancing further. 5/2020 WHO Finally Admits Coronavirus Is Airborne. It’s Too Late 5/2020 Why the WHO took two years to say COVID is airborne 4/2022 Nature.com Why you should close the toilet lid. Study shows flushing creates clouds that can carry viruses 6/2020 WHO: The coronavirus may be airborne and could float beyond 6 feet in restaurants, bars, and other indoor locations 7/2020
Back to Table of Contents
Hand Dryer Concerns & Bathroom Physics
Back to Table of Contents
Fecal-Oral Transmission
Back to Table of Contents
Fomite (Contact) Transmission
Graphic source: https://twitter.com/WebMD/status/1249276076146282496
Graphic source: https://www.newyorker.com/science/elements/from-bats-to-human-lungs-the-evolution-of-a-coronavirus
According to researchers at Rocky Mountain Laboratories, some viral particles remain viable up to four hours on copper, twenty-four hours on cardboard, and seventy-two hours on plastic and stainless steel, though the number of viable particles begins to decrease within minutes.
Household Transmission
Graphic source: https://www.cdc.gov/mmwr/volumes/71/wr/mm7109e1.htm
Are Young Children Super Spreaders of SARS-CoV-2 in Families? 9/2021 CDC: Vaccination Curbed, but Didn't Halt, Omicron in Households - Attack rates still highest among unvaccinated index cases 2/2022 Community transmission and viral load kinetics of the SARS-CoV-2 delta (B.1.617.2) variant in vaccinated and unvaccinated individuals in the UK: a prospective, longitudinal, cohort study 10/2021 Lancet.com Coronavirus spreads quickly among household members, CDC report finds
The report noted that the age of the index patient didn't matter” adults, children and teens all spread the virus to others in their households. 10/2020 Household COVID Omicron spread lower among vaccinated, study finds 6/2023 Household Transmission of SARS-CoV-2 from Children and Adolescents 7/2021 NEJM If You Love Your Family, Stay the Hell Away From Them/ People are letting their guards down while visiting loved ones, and it's putting them and everyone else around them at risk. 8/2020 Kids sick with Covid are filling up children's hospitals in areas seeing spikes
Absolutely household infections are the beginning of this pandemic, that is a major driving force in the spread of infections. We see it often within households, parents to children a pediatrician said. 8/2021 More than 70% of US household COVID spread started with a child, study suggests 6/2023 SARS-CoV-2 B.1.1.529 (Omicron) Variant Transmission Within Households - Four U.S. Jurisdictions, November 2021–February 2022 2/2022 MMWR Transmission of SARS-COV-2 Infections in Households -Tennessee and Wisconsin, April-September 2020 10/2020
Back to Table of Contents
Person to Person (Droplet/Respiratory; Saliva) Transmission
(A) Schlieren image (visualization using light refraction caused by differences in air density) of a human cough, and (B) flash photo of a human sneeze
Graphic source: https://www.ncbi.nlm.nih.gov/books/NBK143281/
Graphic source: https://cosmosmagazine.com/physics/when-you-cough-how-far-can-it-go
Graphic source: https://www.gao.gov/products/GAO-20-545SP
Graphic source: https://www.gao.gov/products/GAO-20-545SP
Determining the necessary spacing for effective social distancing, such as for riders in a subway car, can affect the extent of disease transmission. The shaded circle (top) shows the number of people who could be directly infected by droplets from a sick person.
Back to Table of Contents
Sexual Transmission (Being investigated)
Vertical Transmission
Zoonotic Transmission
Graphic source: https://www.biorxiv.org/content/10.1101/2022.02.22.481551v1
Other Forms of Reported Transmission
Back to Table of Contents
Back to Table of Contents
Search Betty C. Jung's Web site
Search the Entire Internet
Back to Table of Contents
PUBLISHED ON THE WEB: March 30, 2020
Links
Back to Top
© Copyright 2020-2026 Betty C. Jung


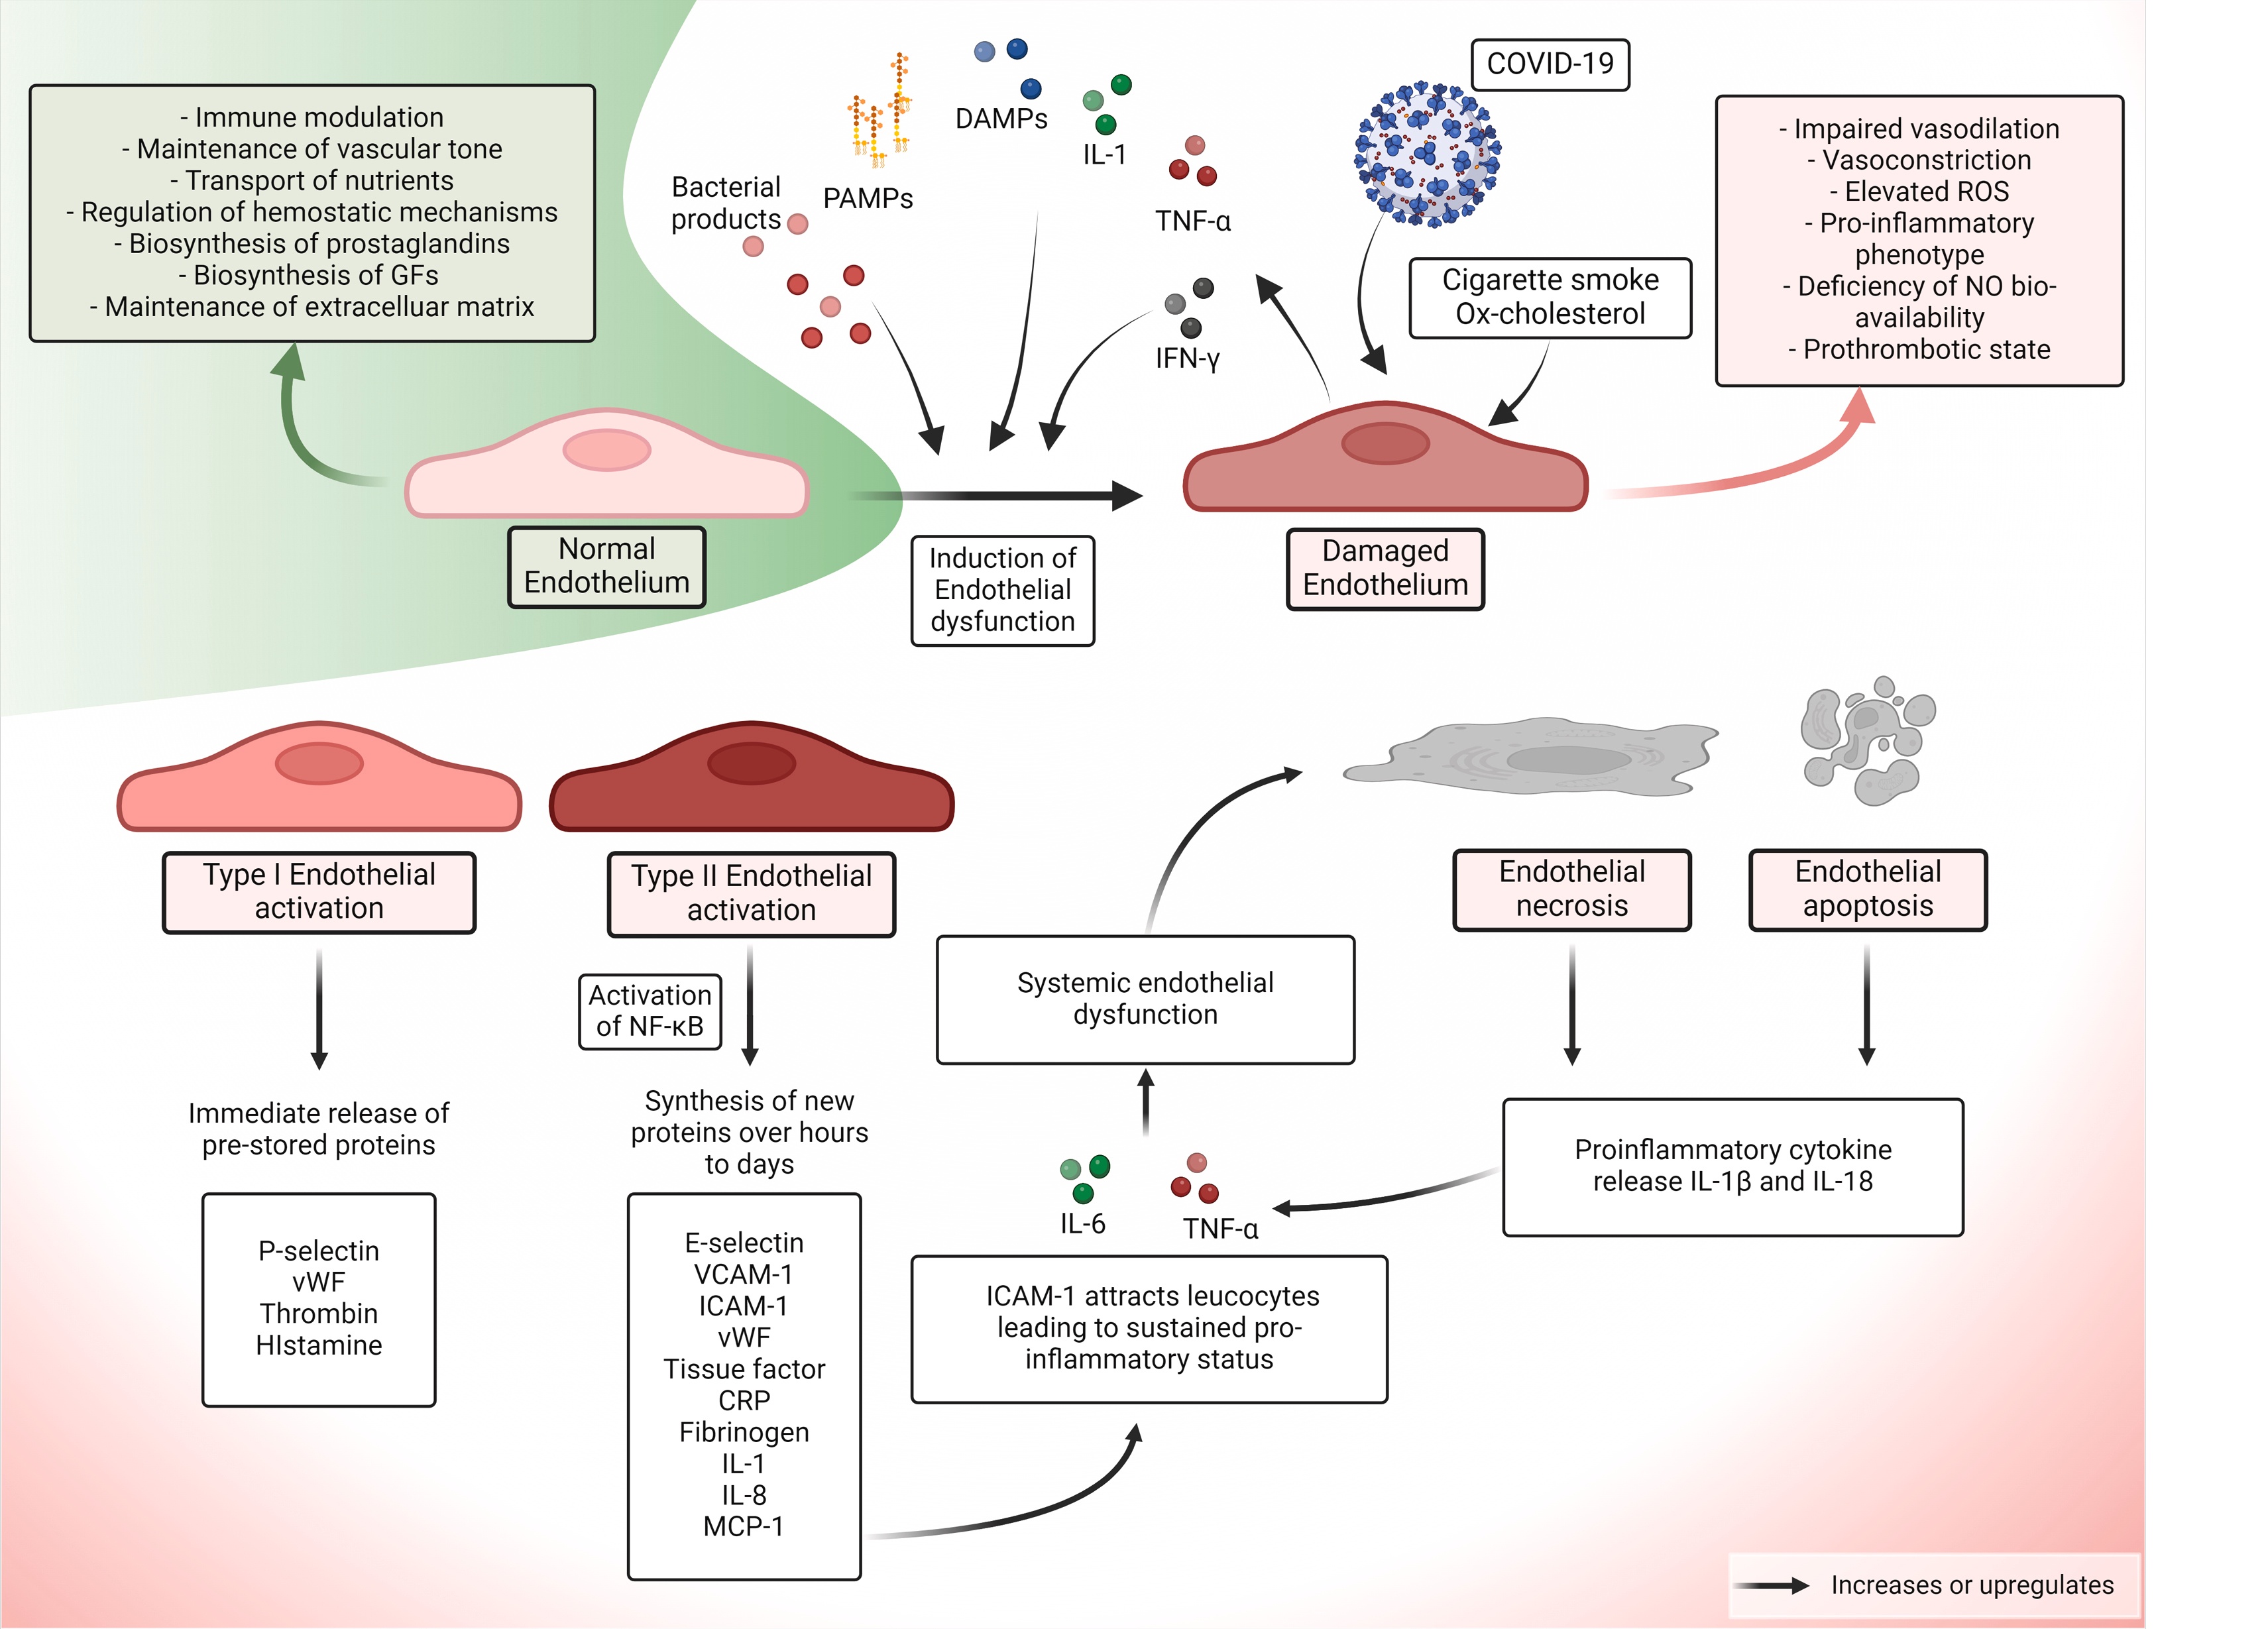


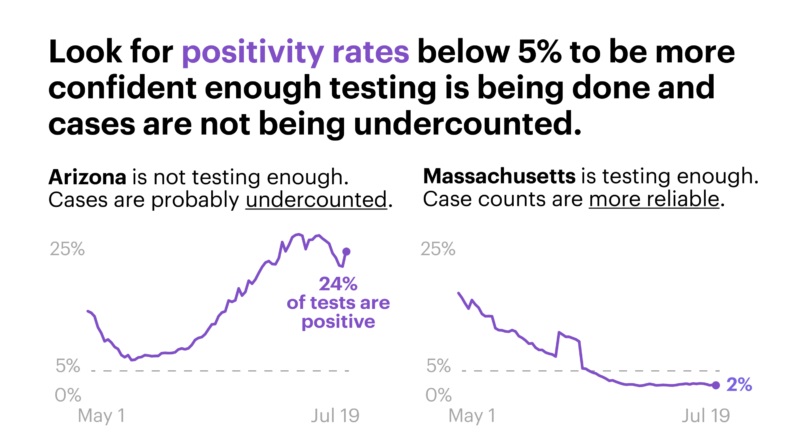


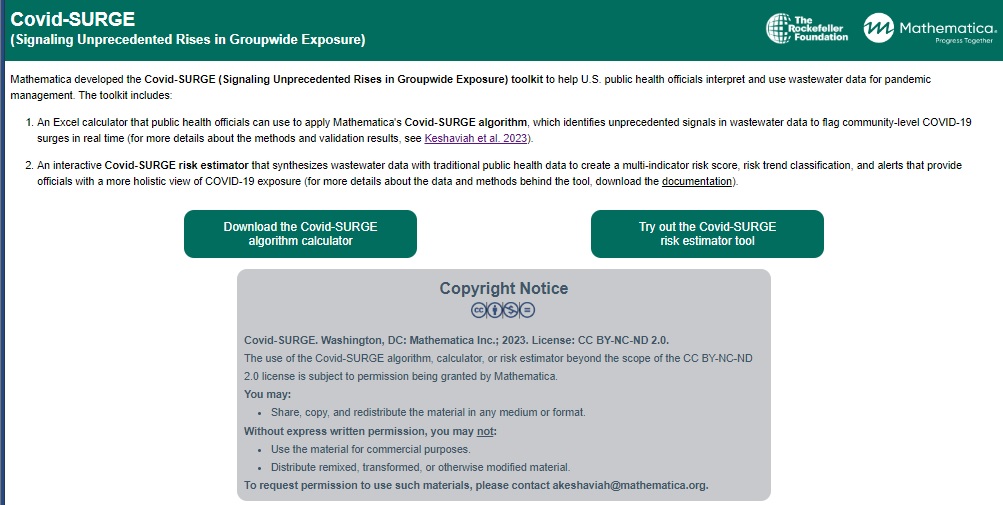


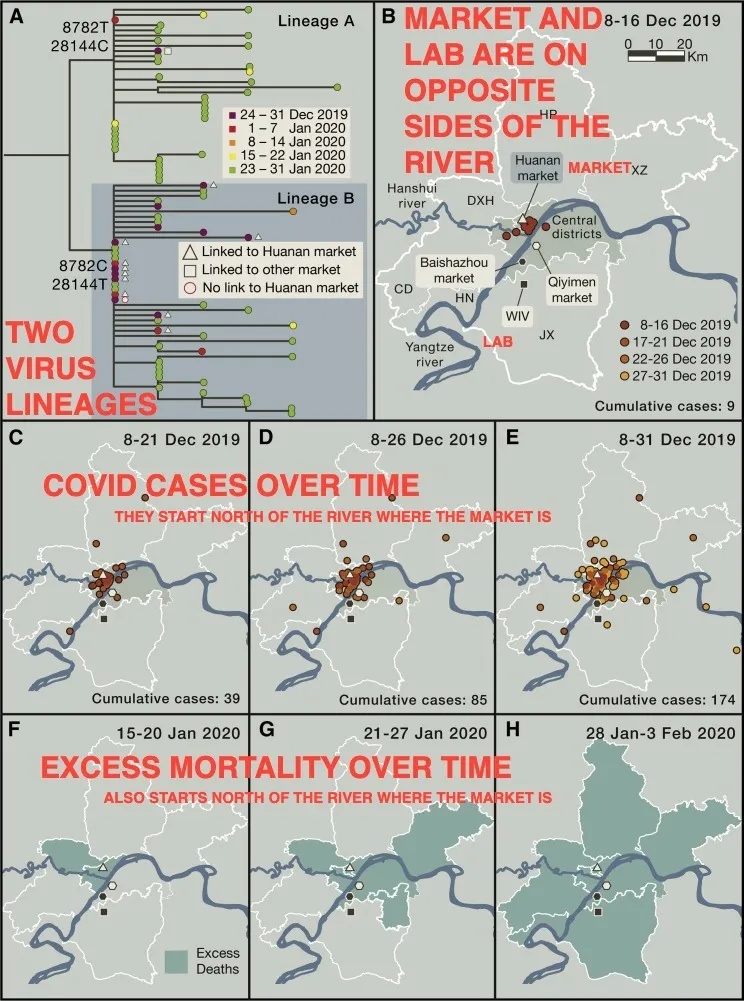
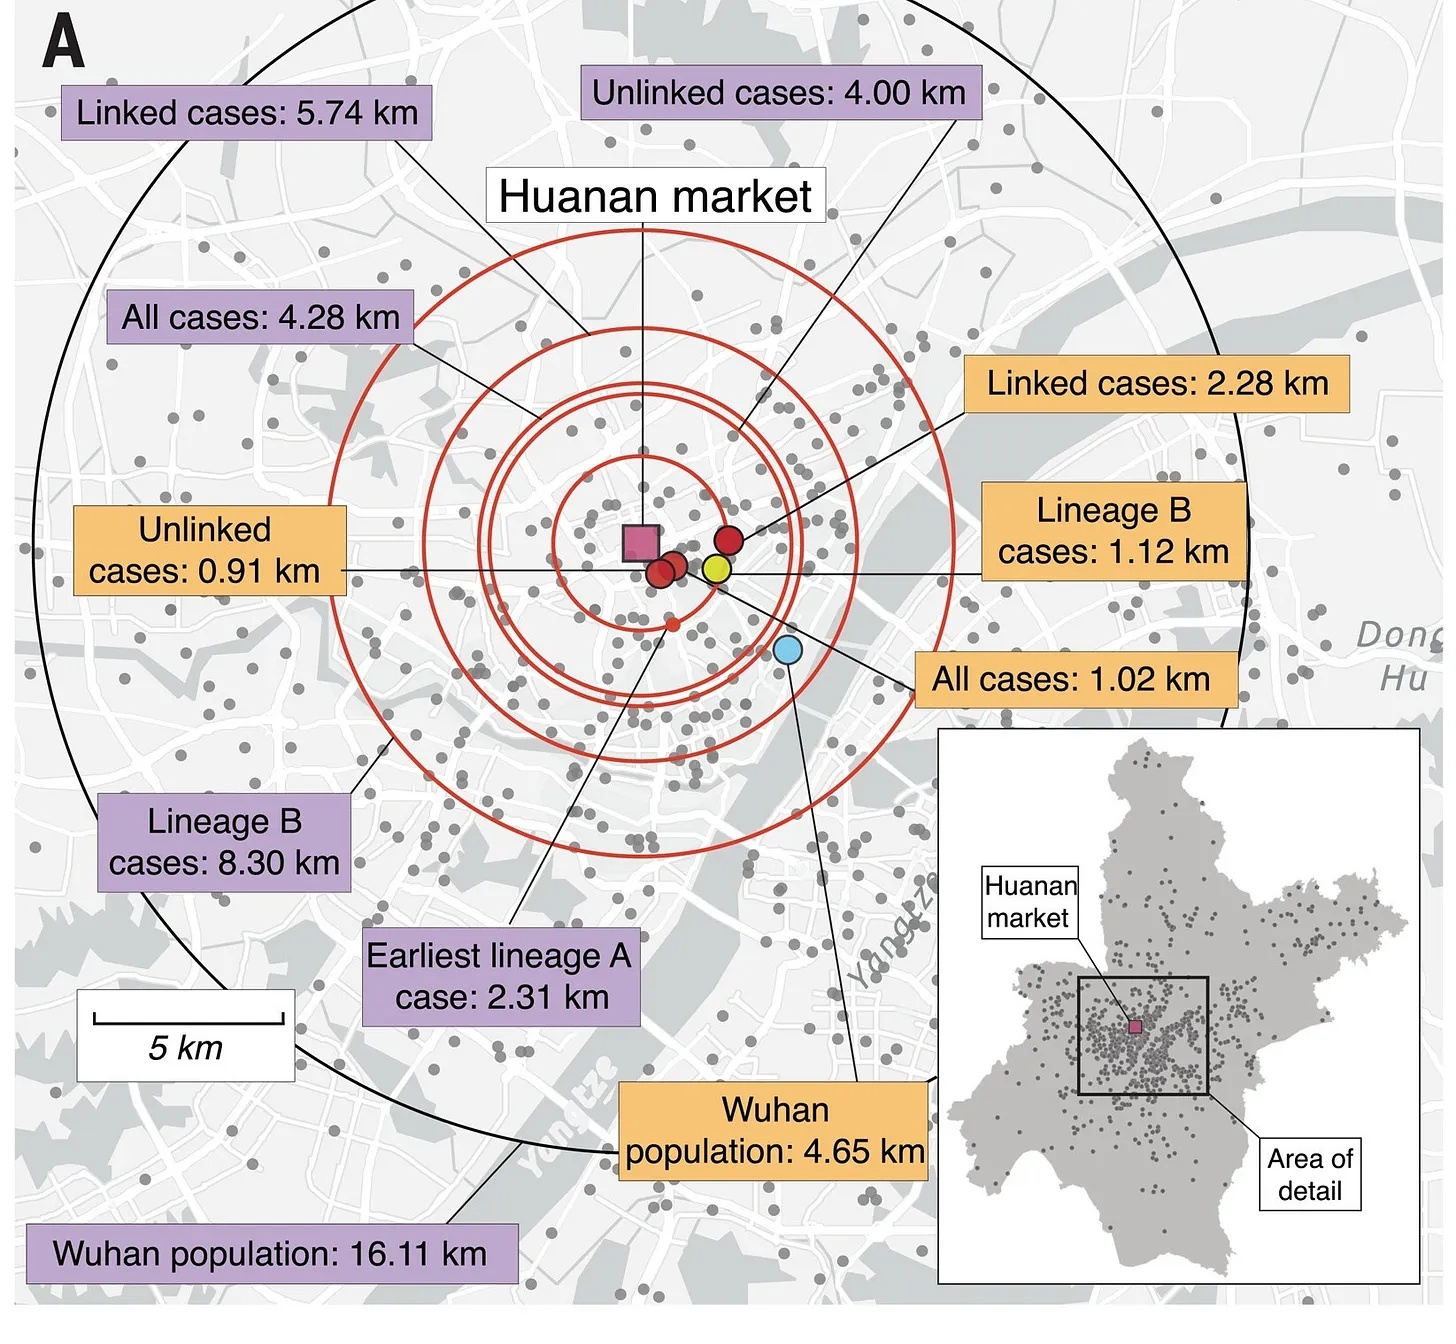
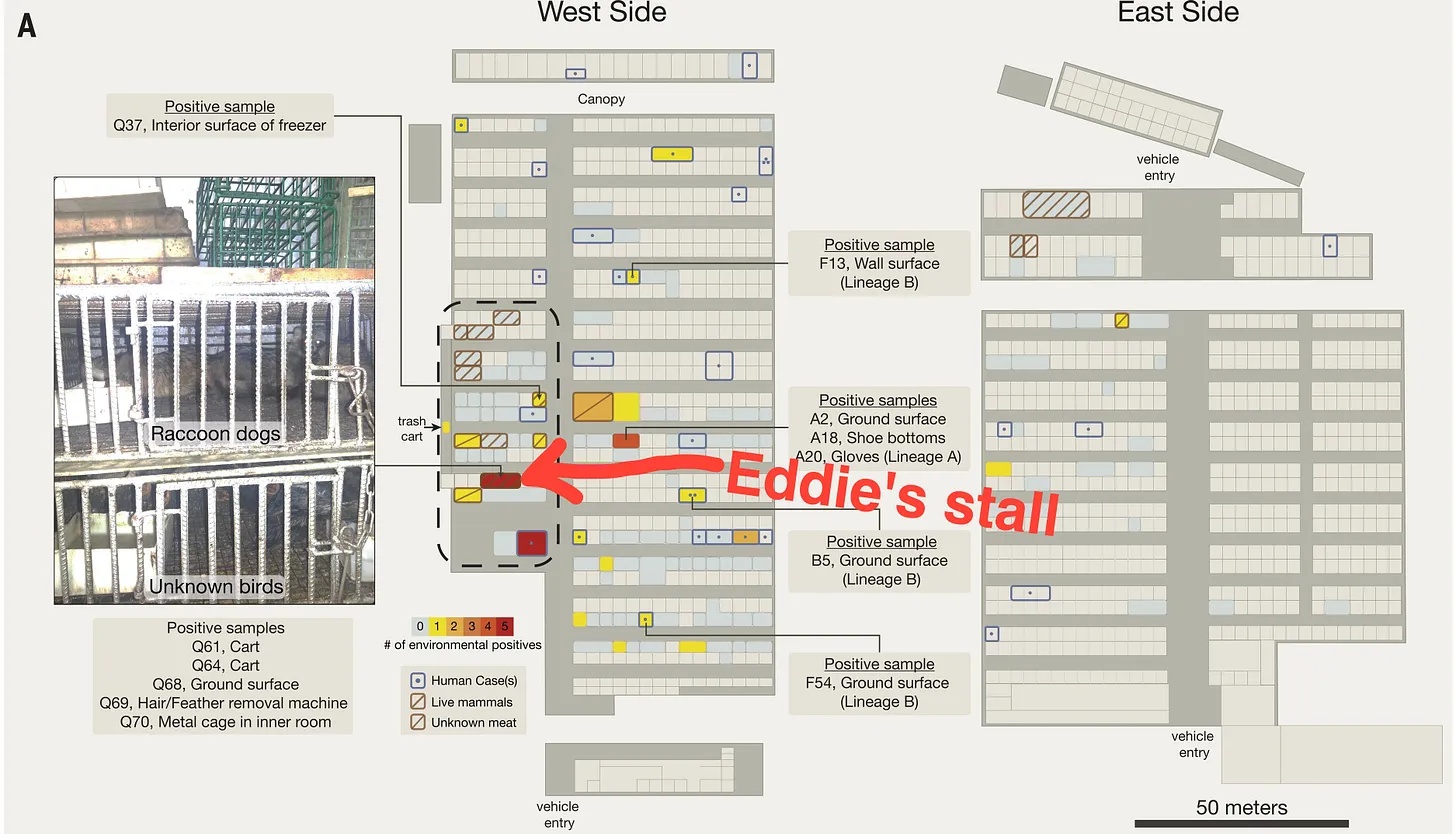
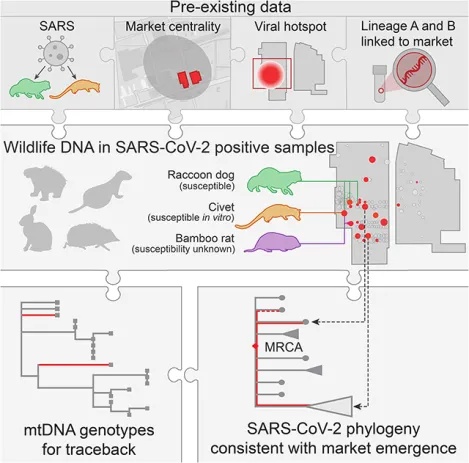
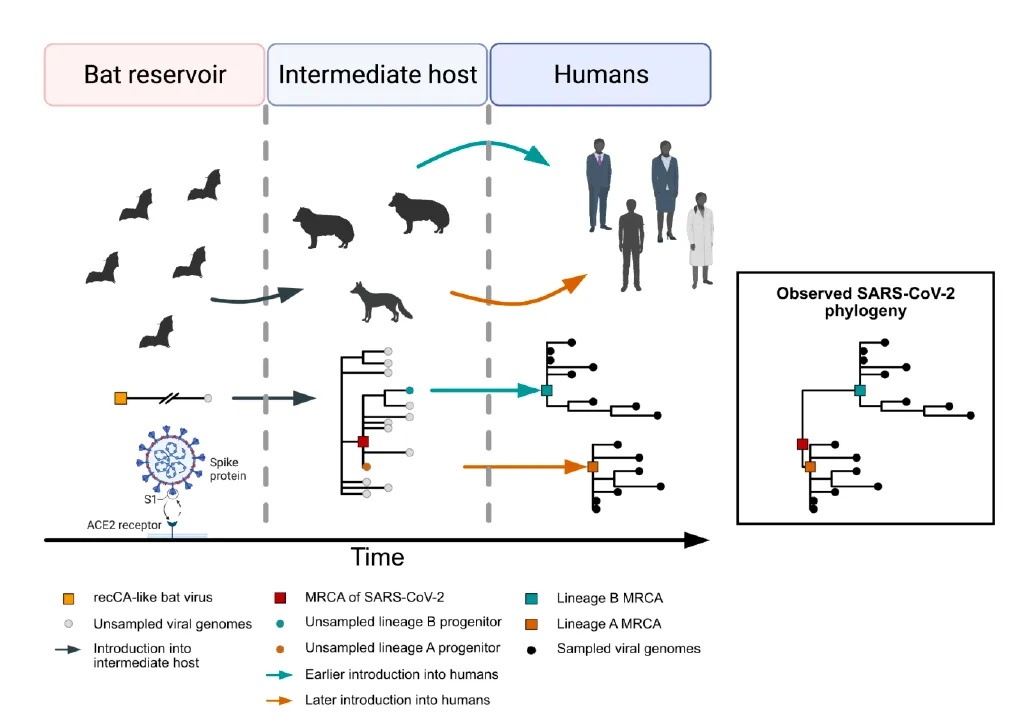
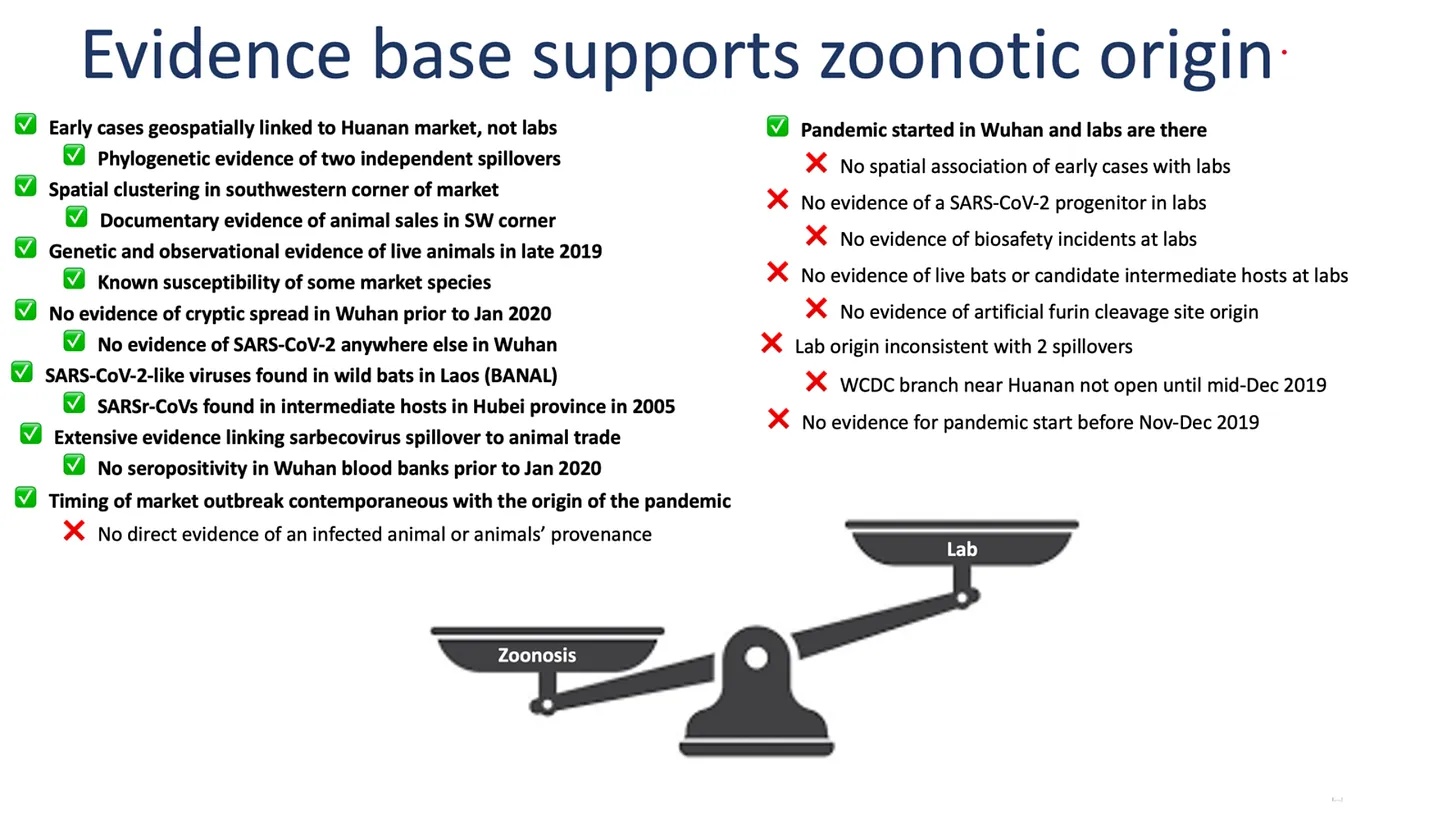


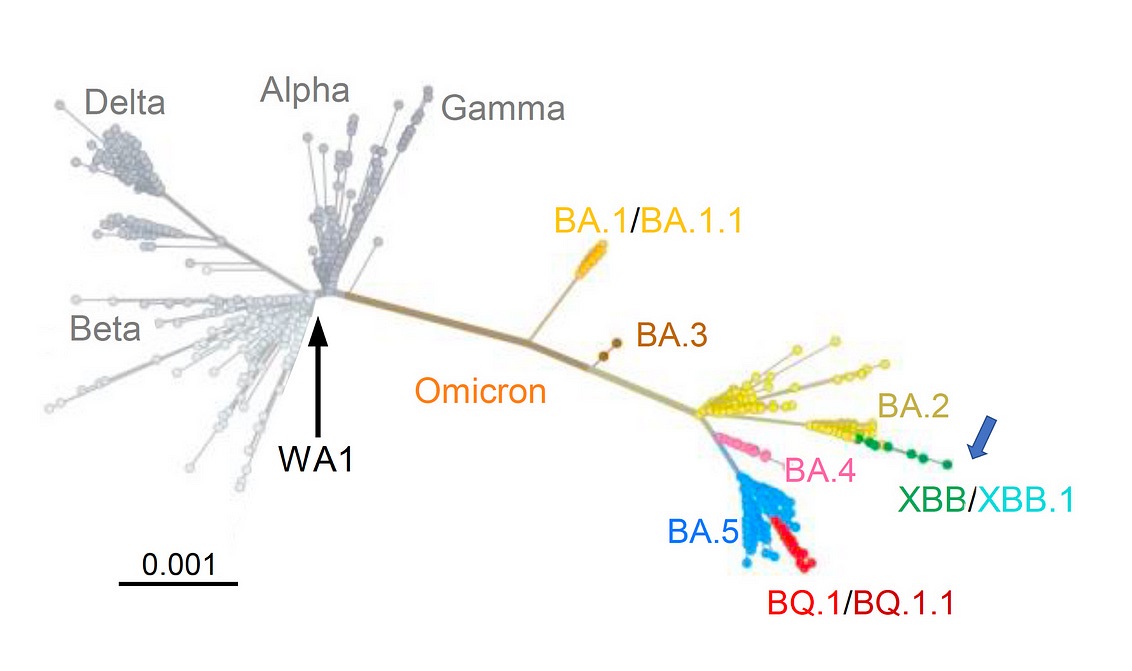


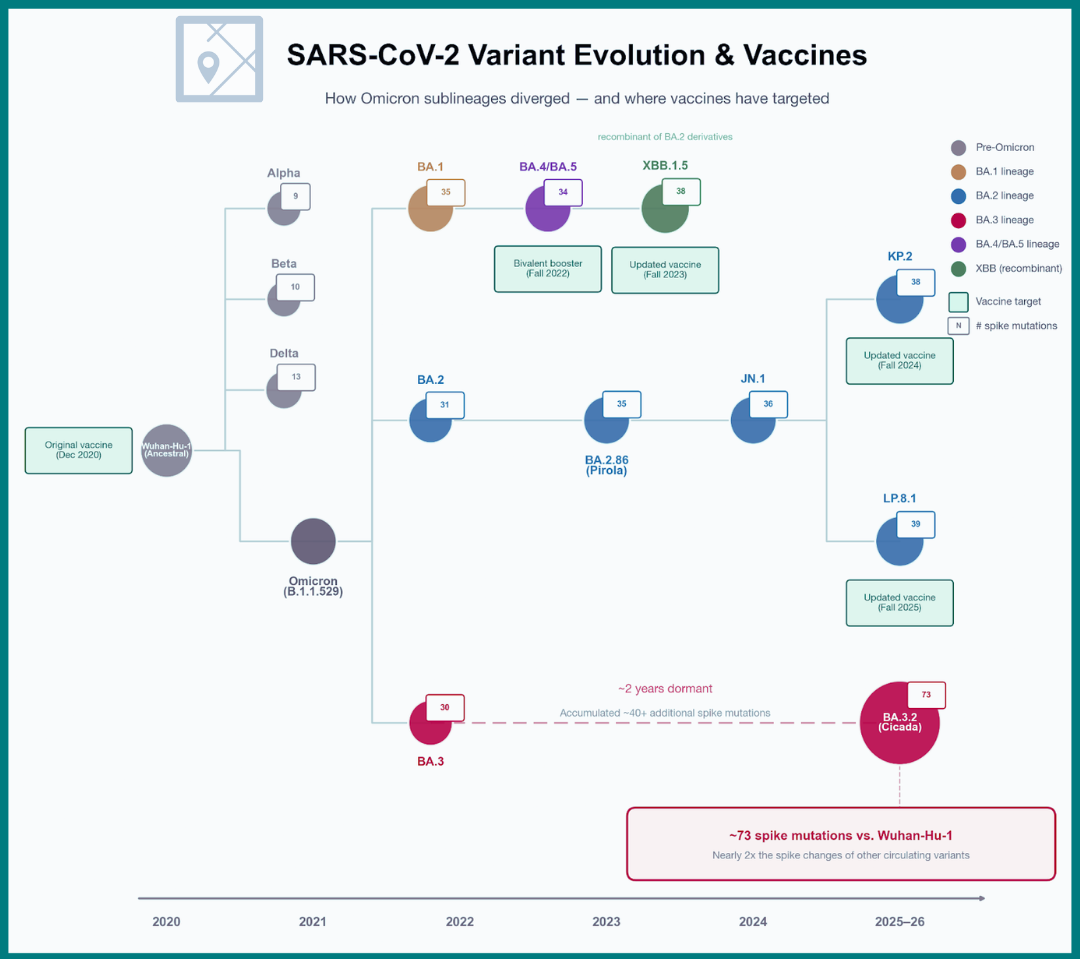


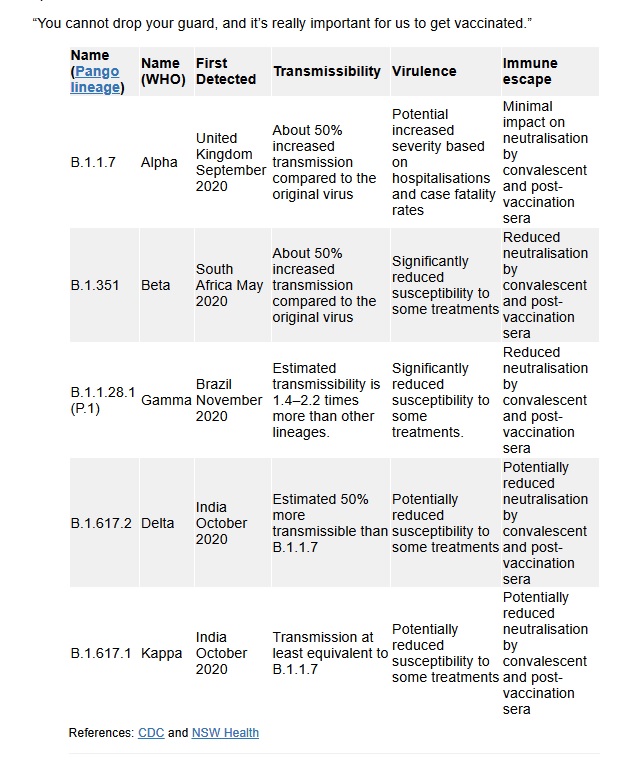


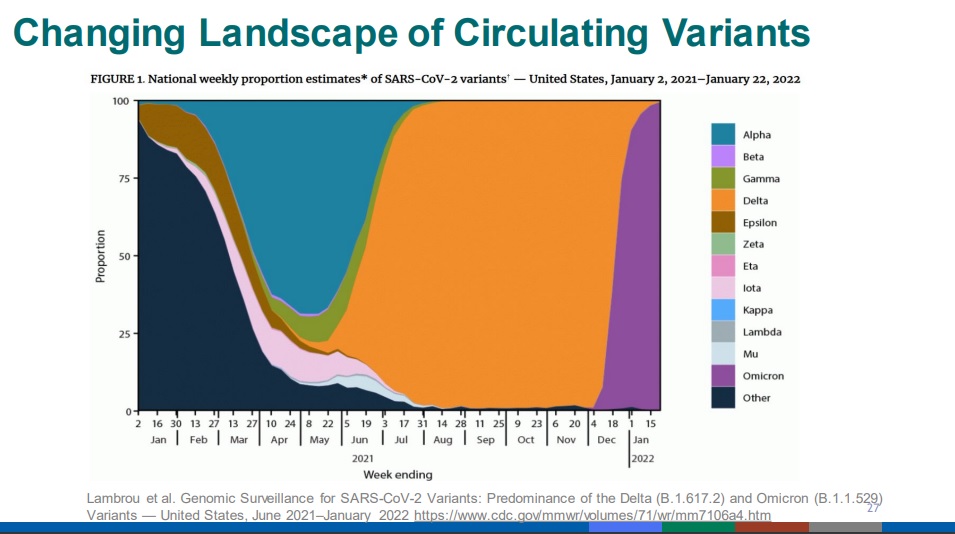


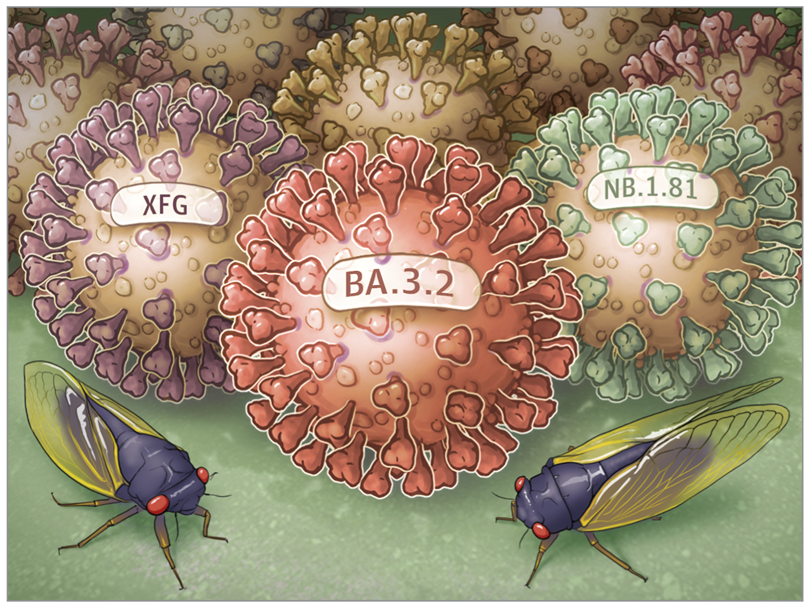
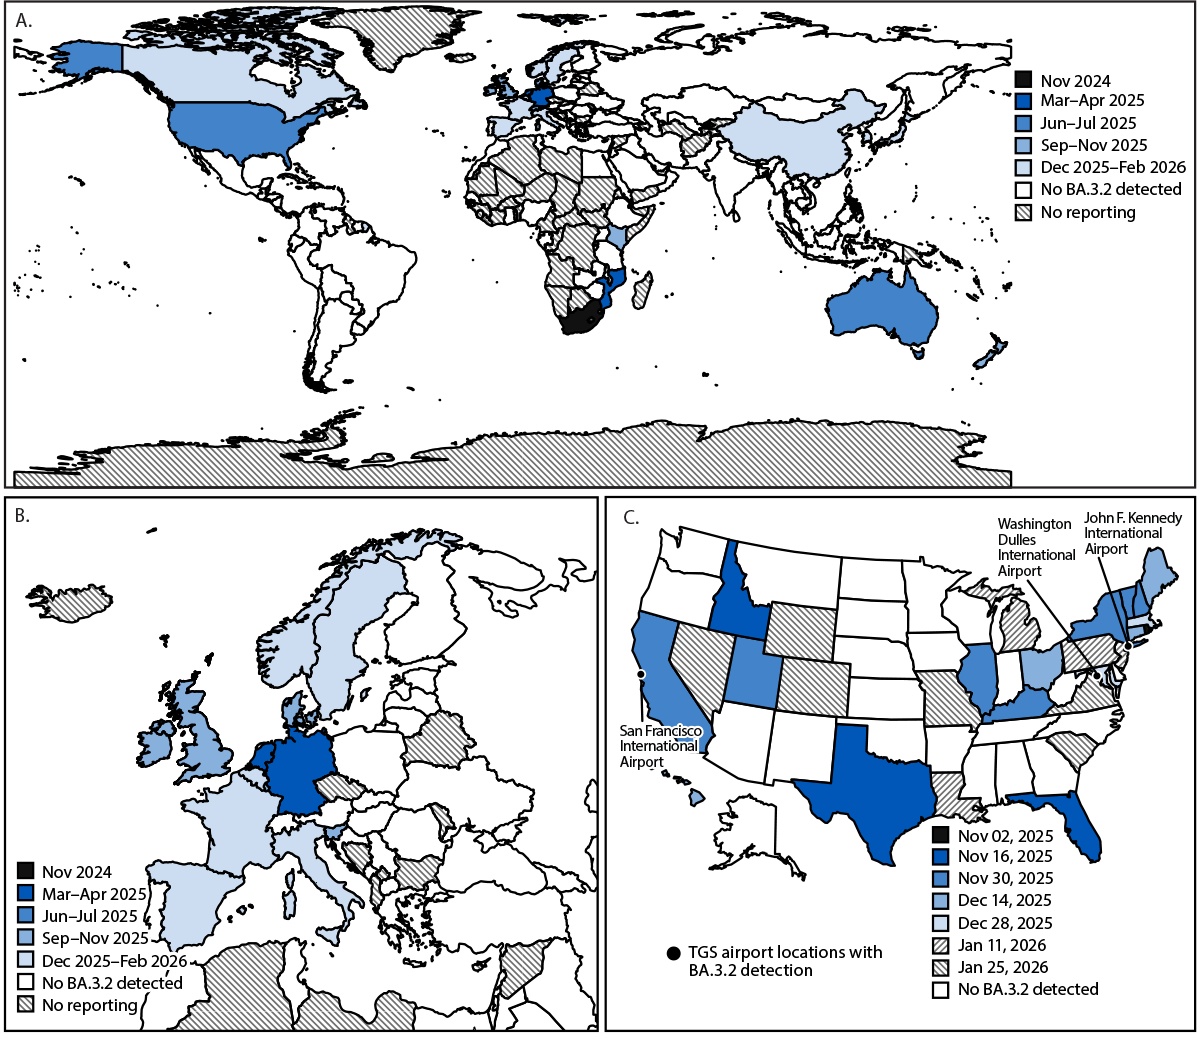


 Graphic source: https://archive.md/KK2GC#selection-897.0-909.85


 00
00


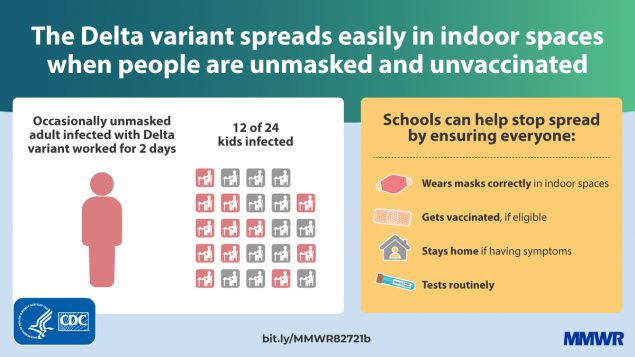


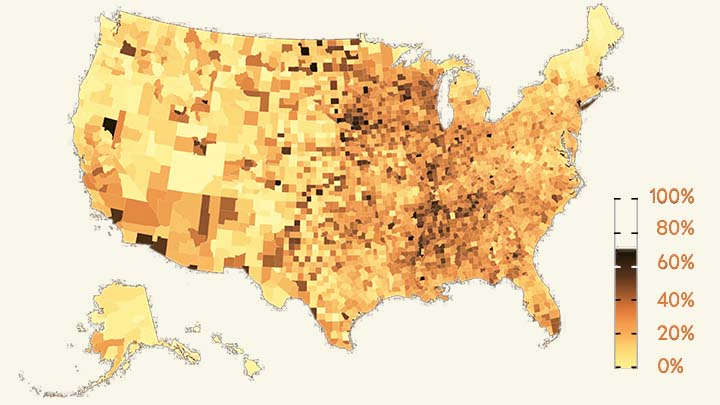


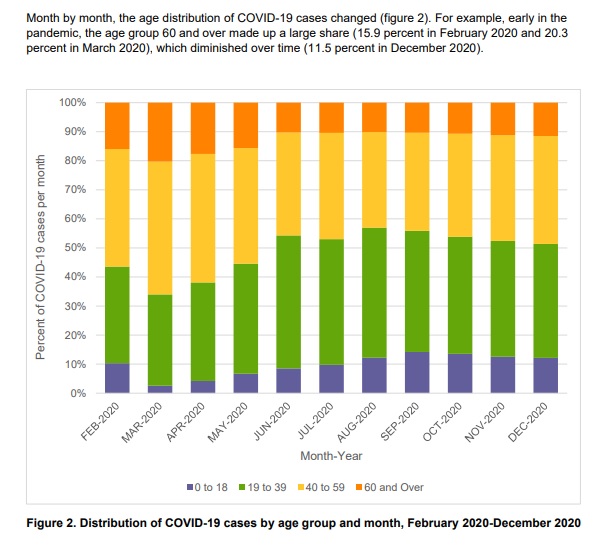


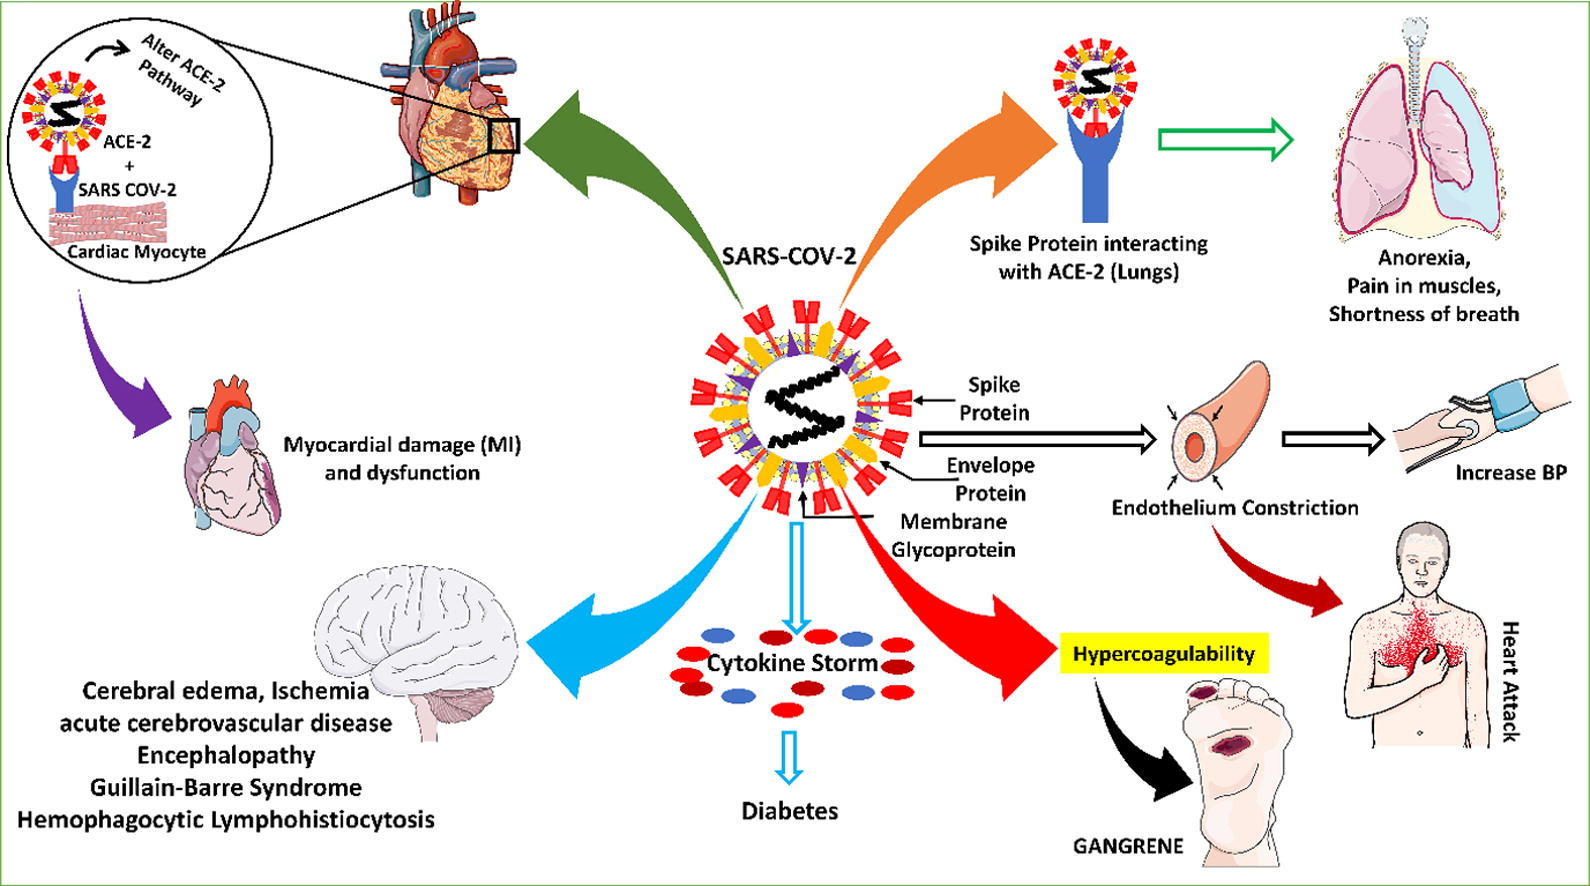


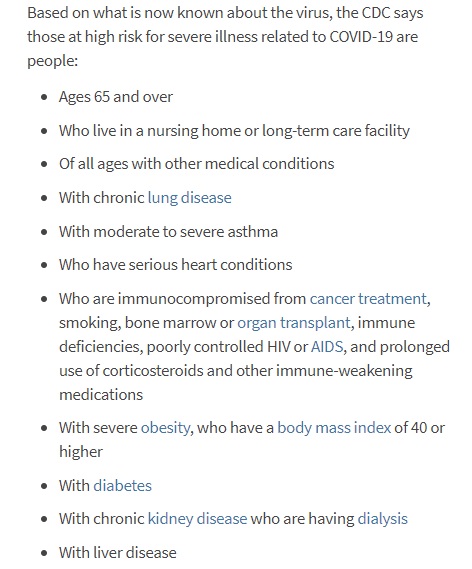
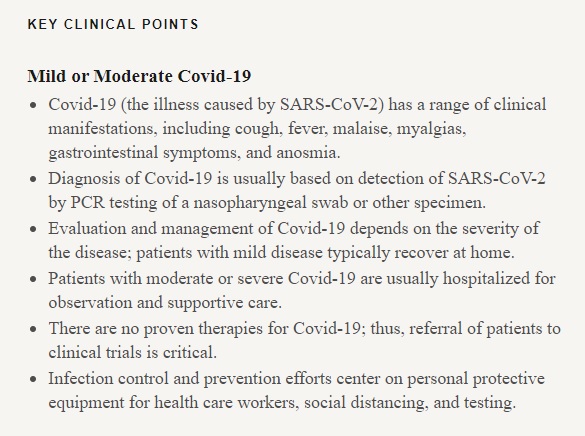
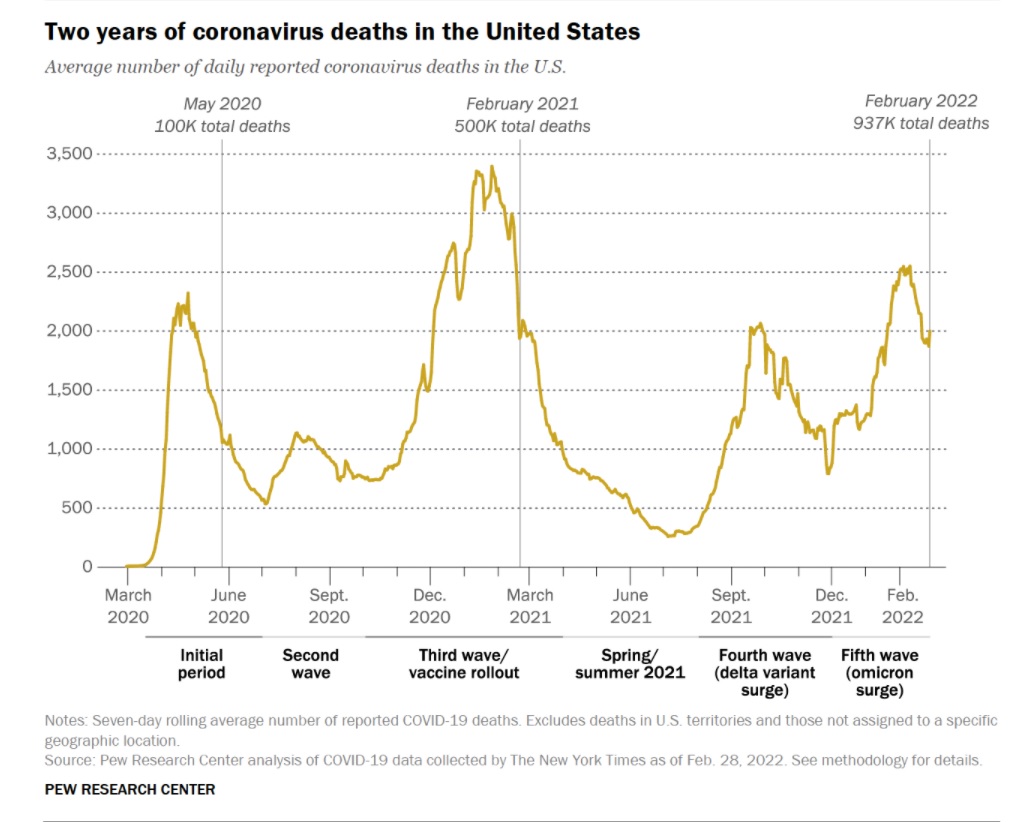


 Graphic source: https://www.cdc.gov/mmwr/volumes/70/wr/mm7023e1.htm